| Param | Original file | Final file |
|---|---|---|
| Filename | modeM0/AS1A09_038T13_9000003928cztM0_level2_bc.evt | modeM0/AS1A09_038T13_9000003928cztM0_level2_quad_clean.evt |
| Size (bytes) | 324,368,640 | 133,050,240 |
| Size | 309.3 MB | 126.9 MB |
| Events in quadrant A | 1,682,919 | 928,867 |
| Events in quadrant B | 1,652,116 | 937,621 |
| Events in quadrant C | 3,626,889 | 816,302 |
| Events in quadrant D | 2,403,290 | 885,015 |
| Mode M0 | |||
|---|---|---|---|
| Quadrant | BADHDUFLAG | Total packets | Discarded packets |
| A | 0 | 14583 | 0 |
| B | 0 | 14426 | 0 |
| C | 0 | 22127 | 0 |
| D | 0 | 16721 | 0 |
| Mode M9 | |||
|---|---|---|---|
| Quadrant | BADHDUFLAG | Total packets | Discarded packets |
| A | 0 | 14 | 0 |
| B | 0 | 14 | 0 |
| C | 0 | 14 | 0 |
| D | 0 | 14 | 0 |
| Mode SS | |||
|---|---|---|---|
| Quadrant | BADHDUFLAG | Total packets | Discarded packets |
| A | 0 | 134 | 0 |
| B | 0 | 134 | 0 |
| C | 0 | 134 | 0 |
| D | 0 | 134 | 0 |
| Quadrant | Total seconds | Saturated seconds | Saturation percentage |
|---|---|---|---|
| A | 6628 | 209 | 3.153289% |
| B | 6628 | 234 | 3.530477% |
| C | 6628 | 1141 | 17.214846% |
| D | 6628 | 264 | 3.983102% |
Noise dominated data is calculated using 1-second bins in cleaned event files. If a bin has >2000 counts, and if more than 50% of those come from <1% of pixels, then it is considered to be noise-dominated and hence unusable.
| Quadrant | # 1 sec bins | Bins with >0 counts | Bins with >2000 counts | High rate bins dominated by noise | Noise dominated (total time) | Noise dominated (detector-on time) | Marked lightcurve |
|---|---|---|---|---|---|---|---|
| A | 7917 | 6627 | 0 | 0 | 0.00% | 0.00% |  |
| B | 7917 | 6626 | 0 | 0 | 0.00% | 0.00% |  |
| C | 7917 | 6626 | 140 | 140 | 1.77% | 2.11% | 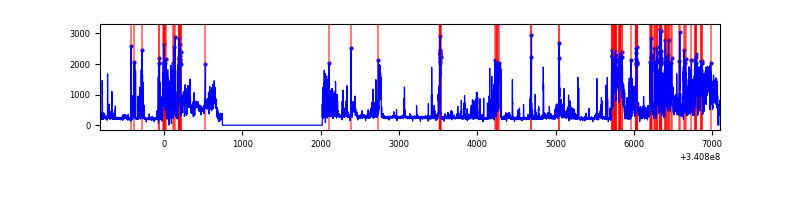 |
| D | 7917 | 6627 | 21 | 21 | 0.27% | 0.32% |  |
Top three noisy pixels from each quadrant. If the there are fewer than three noisy pixels in the level2.evt file, extra rows are filled as -1
| Pixel properties | Quadrant properties | ||||||
|---|---|---|---|---|---|---|---|
| Quadrant | DetID | PixID | Counts | Sigma | Mean | Median | Sigma |
| A | 15 | 174 | 78643 | 884.9 | 408 | 404 | 88.4 |
| A | 6 | 16 | 24114 | 268.17 | 408 | 404 | 88.4 |
| A | 13 | 254 | 10935 | 119.11 | 408 | 404 | 88.4 |
| B | 7 | 205 | 18188 | 226.67 | 410 | 404 | 78.5 |
| B | 15 | 33 | 17523 | 218.19 | 410 | 404 | 78.5 |
| B | 0 | 229 | 14955 | 185.46 | 410 | 404 | 78.5 |
| C | 2 | 16 | 1828887 | 21238.68 | 361 | 361 | 86.1 |
| C | 15 | 208 | 408237 | 4737.56 | 361 | 361 | 86.1 |
| C | 1 | 16 | 2530 | 25.19 | 361 | 361 | 86.1 |
| D | 1 | 52 | 701244 | 7554.58 | 396 | 388 | 92.8 |
| D | 2 | 250 | 112013 | 1203.21 | 396 | 388 | 92.8 |
| D | 2 | 120 | 30309 | 322.52 | 396 | 388 | 92.8 |
Histogram calculated using DETX and DETY for each event in the final _common_clean file
| Quadrant A |  |
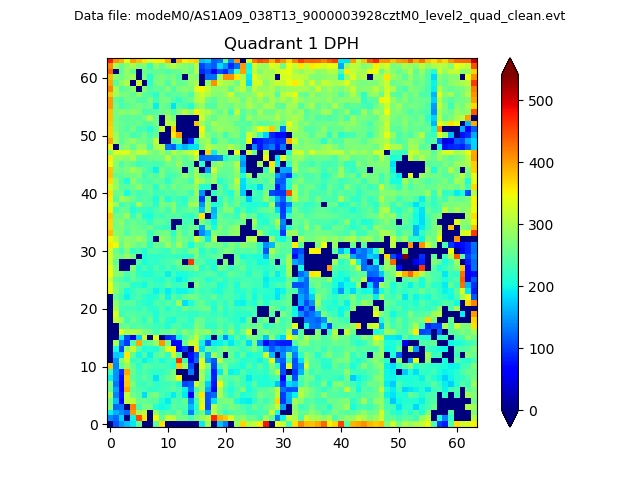 |
Quadrant B |
|---|---|---|---|
| Quadrant D |  |
 |
Quadrant C |
| Plot type | Count rate plots | Images |
|---|---|---|
| Comparison with Poisson distribution Blue bars denote a histogram of data divided into 1 sec bins. Red curve is a Poisson curve with rate = median count rate of data. |
 |
 |
| Quadrant-wise count rates Data is divided into 100 sec bins |
 |
|
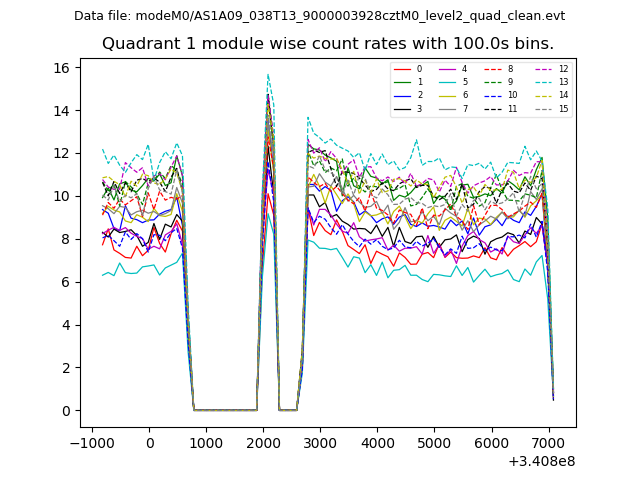
| Module-wise count rates for Quadrant A Data is divided into 100 sec bins |
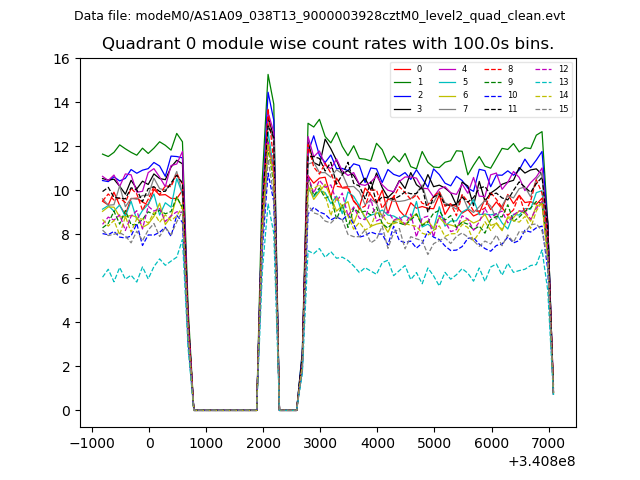 |
 |
| Module-wise count rates for Quadrant B Data is divided into 100 sec bins |
 |
 |
| Module-wise count rates for Quadrant C Data is divided into 100 sec bins |
 |
 |
| Module-wise count rates for Quadrant D Data is divided into 100 sec bins |
 |
 |
| Parameter | Plot |
|---|---|
| CZT HV Monitor |  |
| D_VDD |  |
| Temperature 1 |  |
| Veto HV Monitor |  |
| Veto LLD |  |
| Alpha Counter |  |
| _CPM_Rate |  |
| CZT Counter |  |
| +2.5 Volts monitor |  |
| +5 Volts monitor |  |
| _ROLL_ROT |  |
| _Roll_DEC |  |
| _Roll_RA | 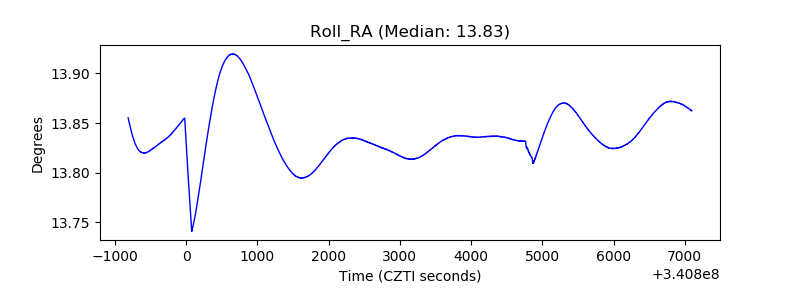 |
| Veto Counter | 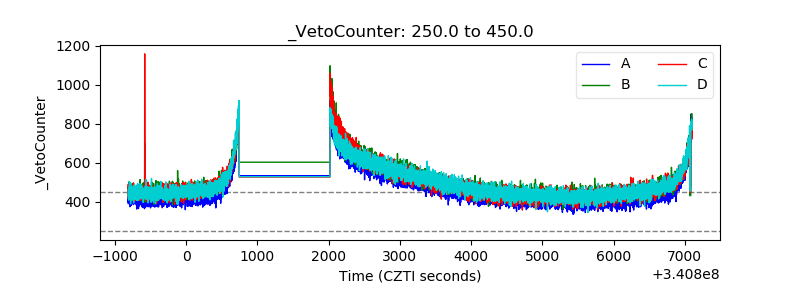 |