| Param | Original file | Final file |
|---|---|---|
| Filename | modeM0/AS1A09_038T12_9000003926cztM0_level2_bc.evt | modeM0/AS1A09_038T12_9000003926cztM0_level2_quad_clean.evt |
| Size (bytes) | 445,248,000 | 180,290,880 |
| Size | 424.6 MB | 171.9 MB |
| Events in quadrant A | 2,181,918 | 1,261,598 |
| Events in quadrant B | 2,247,940 | 1,280,089 |
| Events in quadrant C | 3,152,551 | 1,194,887 |
| Events in quadrant D | 5,330,758 | 1,148,031 |
| Mode M9 | |||
|---|---|---|---|
| Quadrant | BADHDUFLAG | Total packets | Discarded packets |
| A | 0 | 25 | 0 |
| B | 0 | 25 | 0 |
| C | 0 | 25 | 0 |
| D | 0 | 25 | 0 |
| Mode M0 | |||
|---|---|---|---|
| Quadrant | BADHDUFLAG | Total packets | Discarded packets |
| A | 0 | 18532 | 0 |
| B | 0 | 18803 | 0 |
| C | 0 | 22919 | 0 |
| D | 0 | 28440 | 0 |
| Mode SS | |||
|---|---|---|---|
| Quadrant | BADHDUFLAG | Total packets | Discarded packets |
| A | 0 | 168 | 0 |
| B | 0 | 168 | 0 |
| C | 0 | 168 | 0 |
| D | 0 | 168 | 0 |
| Quadrant | Total seconds | Saturated seconds | Saturation percentage |
|---|---|---|---|
| A | 8289 | 139 | 1.676921% |
| B | 8289 | 202 | 2.436965% |
| C | 8289 | 627 | 7.564242% |
| D | 8289 | 1309 | 15.792014% |
Noise dominated data is calculated using 1-second bins in cleaned event files. If a bin has >2000 counts, and if more than 50% of those come from <1% of pixels, then it is considered to be noise-dominated and hence unusable.
| Quadrant | # 1 sec bins | Bins with >0 counts | Bins with >2000 counts | High rate bins dominated by noise | Noise dominated (total time) | Noise dominated (detector-on time) | Marked lightcurve |
|---|---|---|---|---|---|---|---|
| A | 10829 | 8290 | 0 | 0 | 0.00% | 0.00% |  |
| B | 10829 | 8288 | 1 | 1 | 0.01% | 0.01% |  |
| C | 10829 | 8287 | 76 | 76 | 0.70% | 0.92% | 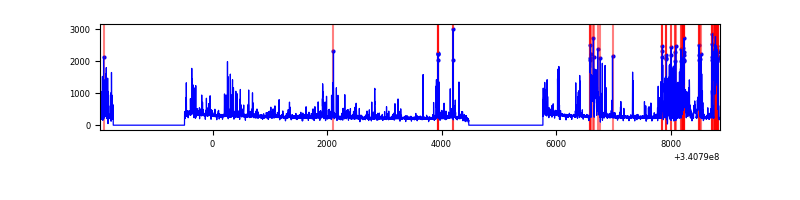 |
| D | 10829 | 8288 | 752 | 752 | 6.94% | 9.07% |  |
Top three noisy pixels from each quadrant. If the there are fewer than three noisy pixels in the level2.evt file, extra rows are filled as -1
| Pixel properties | Quadrant properties | ||||||
|---|---|---|---|---|---|---|---|
| Quadrant | DetID | PixID | Counts | Sigma | Mean | Median | Sigma |
| A | 13 | 254 | 12657 | 103.39 | 560 | 555 | 117.0 |
| A | 8 | 192 | 9715 | 78.25 | 560 | 555 | 117.0 |
| A | 15 | 174 | 5692 | 43.88 | 560 | 555 | 117.0 |
| B | 15 | 32 | 43992 | 420.47 | 561 | 555 | 103.3 |
| B | 0 | 190 | 19713 | 185.45 | 561 | 555 | 103.3 |
| B | 7 | 205 | 13365 | 124.0 | 561 | 555 | 103.3 |
| C | 2 | 16 | 1072349 | 8738.49 | 525 | 527 | 122.7 |
| C | 15 | 208 | 63466 | 513.14 | 525 | 527 | 122.7 |
| C | 13 | 61 | 2969 | 19.91 | 525 | 527 | 122.7 |
| D | 1 | 52 | 3038823 | 25673.71 | 517 | 508 | 118.3 |
| D | 2 | 250 | 106638 | 896.8 | 517 | 508 | 118.3 |
| D | 10 | 103 | 78865 | 662.12 | 517 | 508 | 118.3 |
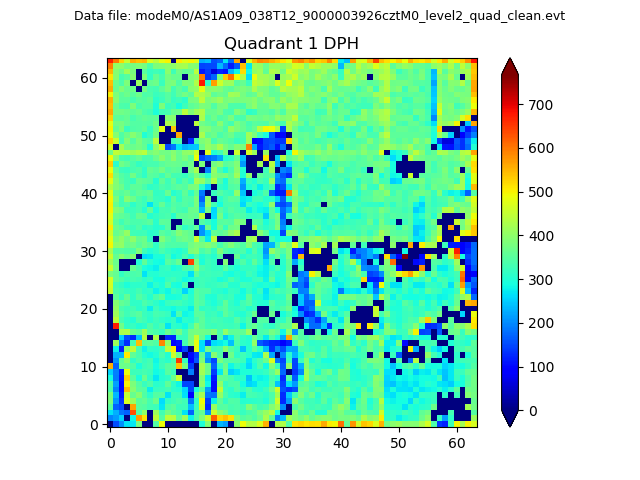
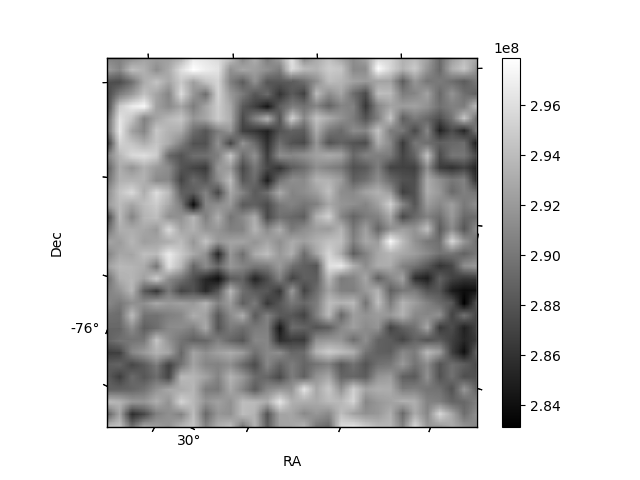
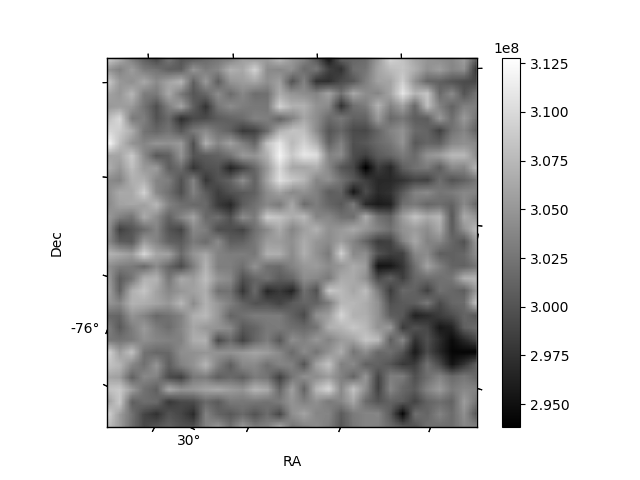
Histogram calculated using DETX and DETY for each event in the final _common_clean file
| Quadrant A |  |
 |
Quadrant B |
|---|---|---|---|
| Quadrant D | 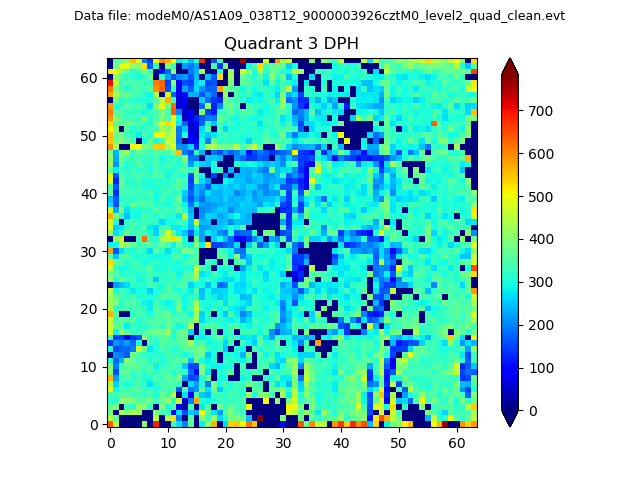 |
 |
Quadrant C |
| Plot type | Count rate plots | Images |
|---|---|---|
| Comparison with Poisson distribution Blue bars denote a histogram of data divided into 1 sec bins. Red curve is a Poisson curve with rate = median count rate of data. |
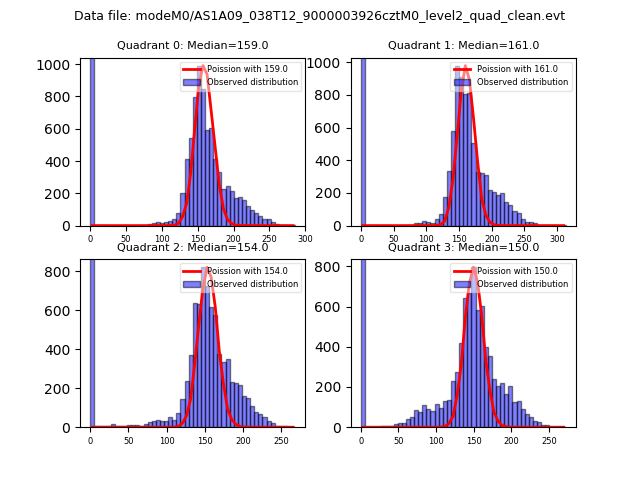 |
 |
| Quadrant-wise count rates Data is divided into 100 sec bins |
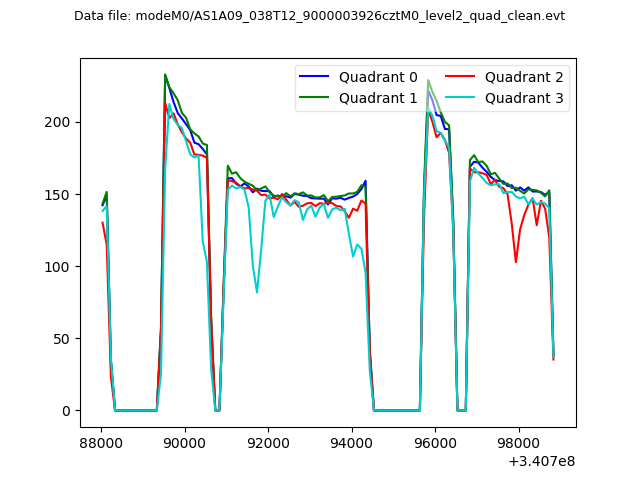 |
|
| Module-wise count rates for Quadrant A Data is divided into 100 sec bins |
 |
 |
| Module-wise count rates for Quadrant B Data is divided into 100 sec bins |
 |
 |
| Module-wise count rates for Quadrant C Data is divided into 100 sec bins |
 |
 |
| Module-wise count rates for Quadrant D Data is divided into 100 sec bins |
 |
 |
| Parameter | Plot |
|---|---|
| CZT HV Monitor |  |
| D_VDD | 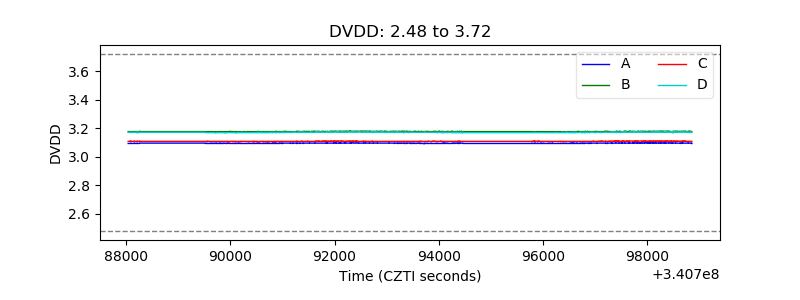 |
| Temperature 1 | 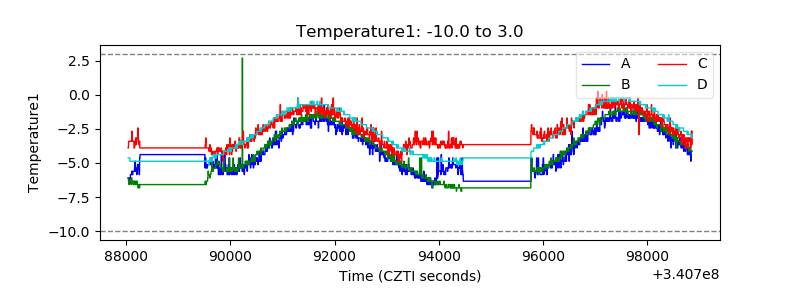 |
| Veto HV Monitor |  |
| Veto LLD |  |
| Alpha Counter |  |
| _CPM_Rate | 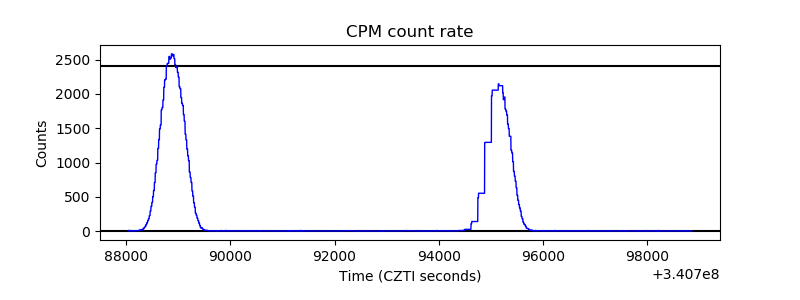 |
| CZT Counter |  |
| +2.5 Volts monitor |  |
| +5 Volts monitor |  |
| _ROLL_ROT | 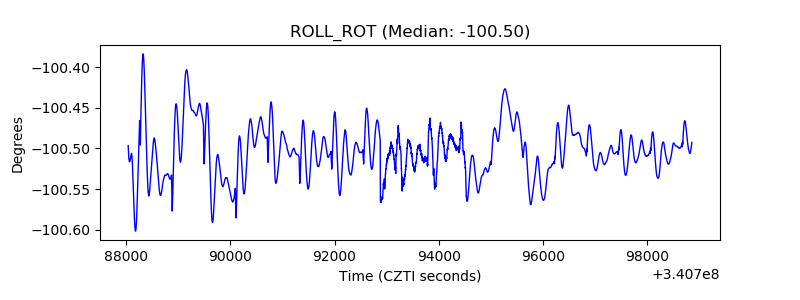 |
| _Roll_DEC |  |
| _Roll_RA |  |
| Veto Counter | 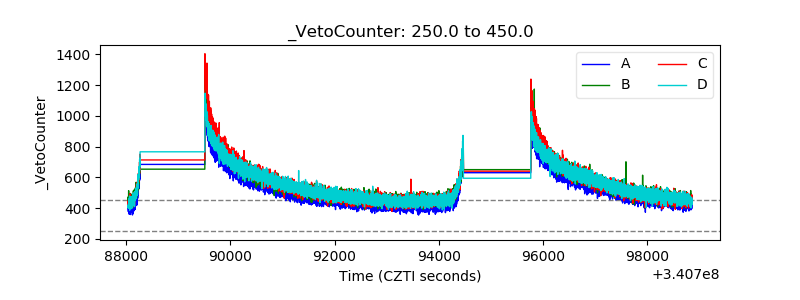 |