| Param | Original file | Final file |
|---|---|---|
| Filename | modeM0/AS1A09_038T11_9000003924cztM0_level2_bc.evt | modeM0/AS1A09_038T11_9000003924cztM0_level2_quad_clean.evt |
| Size (bytes) | 407,681,280 | 142,007,040 |
| Size | 388.8 MB | 135.4 MB |
| Events in quadrant A | 1,641,034 | 1,026,003 |
| Events in quadrant B | 1,714,782 | 1,048,530 |
| Events in quadrant C | 3,670,390 | 796,860 |
| Events in quadrant D | 4,841,181 | 945,936 |
| Mode M0 | |||
|---|---|---|---|
| Quadrant | BADHDUFLAG | Total packets | Discarded packets |
| A | 0 | 14654 | 0 |
| B | 0 | 14777 | 0 |
| C | 0 | 27779 | 0 |
| D | 0 | 24717 | 0 |
| Mode M9 | |||
|---|---|---|---|
| Quadrant | BADHDUFLAG | Total packets | Discarded packets |
| A | 0 | 12 | 0 |
| B | 0 | 12 | 0 |
| C | 0 | 12 | 0 |
| D | 0 | 12 | 0 |
| Mode SS | |||
|---|---|---|---|
| Quadrant | BADHDUFLAG | Total packets | Discarded packets |
| A | 0 | 140 | 0 |
| B | 0 | 140 | 0 |
| C | 0 | 140 | 0 |
| D | 0 | 140 | 0 |
| Quadrant | Total seconds | Saturated seconds | Saturation percentage |
|---|---|---|---|
| A | 6932 | 53 | 0.764570% |
| B | 6932 | 52 | 0.750144% |
| C | 6932 | 2074 | 29.919215% |
| D | 6932 | 1006 | 14.512406% |
Noise dominated data is calculated using 1-second bins in cleaned event files. If a bin has >2000 counts, and if more than 50% of those come from <1% of pixels, then it is considered to be noise-dominated and hence unusable.
| Quadrant | # 1 sec bins | Bins with >0 counts | Bins with >2000 counts | High rate bins dominated by noise | Noise dominated (total time) | Noise dominated (detector-on time) | Marked lightcurve |
|---|---|---|---|---|---|---|---|
| A | 8102 | 6931 | 2 | 2 | 0.02% | 0.03% |  |
| B | 8102 | 6931 | 2 | 2 | 0.02% | 0.03% |  |
| C | 8101 | 6919 | 178 | 178 | 2.20% | 2.57% |  |
| D | 8102 | 6932 | 634 | 634 | 7.83% | 9.15% |  |
Top three noisy pixels from each quadrant. If the there are fewer than three noisy pixels in the level2.evt file, extra rows are filled as -1
| Pixel properties | Quadrant properties | ||||||
|---|---|---|---|---|---|---|---|
| Quadrant | DetID | PixID | Counts | Sigma | Mean | Median | Sigma |
| A | 13 | 248 | 28194 | 310.88 | 415 | 410 | 89.4 |
| A | 13 | 254 | 11893 | 128.49 | 415 | 410 | 89.4 |
| A | 8 | 192 | 5570 | 57.74 | 415 | 410 | 89.4 |
| B | 0 | 190 | 26135 | 318.66 | 419 | 414 | 80.7 |
| B | 5 | 172 | 23609 | 287.37 | 419 | 414 | 80.7 |
| B | 15 | 32 | 18524 | 224.37 | 419 | 414 | 80.7 |
| C | 2 | 16 | 2383281 | 30767.05 | 321 | 322 | 77.5 |
| C | 15 | 208 | 48662 | 624.13 | 321 | 322 | 77.5 |
| C | 4 | 224 | 1964 | 21.2 | 321 | 322 | 77.5 |
| D | 1 | 52 | 3087745 | 32152.14 | 392 | 384 | 96.0 |
| D | 2 | 250 | 176696 | 1836.13 | 392 | 384 | 96.0 |
| D | 2 | 120 | 33900 | 349.04 | 392 | 384 | 96.0 |
Histogram calculated using DETX and DETY for each event in the final _common_clean file
| Quadrant A |  |
 |
Quadrant B |
|---|---|---|---|
| Quadrant D |  |
 |
Quadrant C |
| Plot type | Count rate plots | Images |
|---|---|---|
| Comparison with Poisson distribution Blue bars denote a histogram of data divided into 1 sec bins. Red curve is a Poisson curve with rate = median count rate of data. |
 |
 |
| Quadrant-wise count rates Data is divided into 100 sec bins |
 |
|
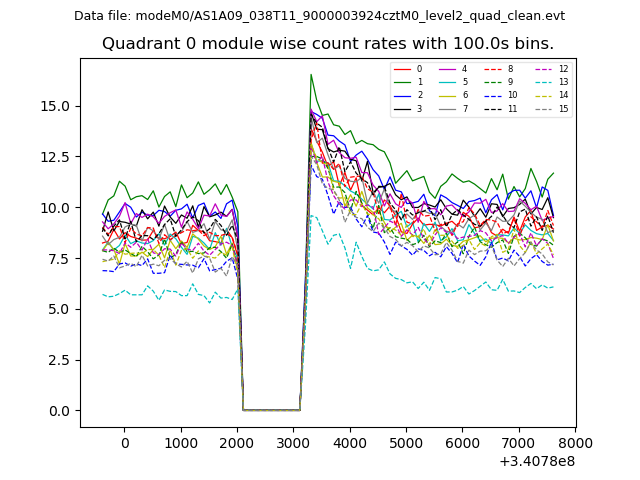
| Module-wise count rates for Quadrant A Data is divided into 100 sec bins |
 |
 |
| Module-wise count rates for Quadrant B Data is divided into 100 sec bins |
 |
 |
| Module-wise count rates for Quadrant C Data is divided into 100 sec bins |
 |
 |
| Module-wise count rates for Quadrant D Data is divided into 100 sec bins |
 |
 |
| Parameter | Plot |
|---|---|
| CZT HV Monitor | 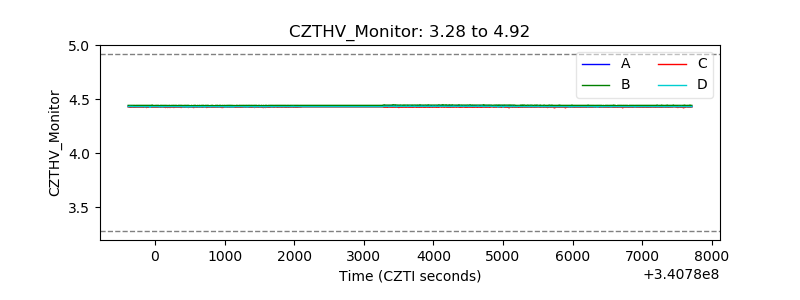 |
| D_VDD |  |
| Temperature 1 |  |
| Veto HV Monitor |  |
| Veto LLD |  |
| Alpha Counter |  |
| _CPM_Rate |  |
| CZT Counter |  |
| +2.5 Volts monitor |  |
| +5 Volts monitor |  |
| _ROLL_ROT |  |
| _Roll_DEC |  |
| _Roll_RA |  |
| Veto Counter |  |