| Param | Original file | Final file |
|---|---|---|
| Filename | modeM0/AS1T03_255T01_9000003922cztM0_level2_bc.evt | modeM0/AS1T03_255T01_9000003922cztM0_level2_quad_clean.evt |
| Size (bytes) | 9,496,272,960 | 3,125,041,920 |
| Size | 8.8 GB | 2.9 GB |
| Events in quadrant A | 51,592,707 | 20,670,019 |
| Events in quadrant B | 63,784,527 | 20,365,554 |
| Events in quadrant C | 68,684,353 | 19,168,433 |
| Events in quadrant D | 88,030,652 | 18,841,677 |
| Mode SS | |||
|---|---|---|---|
| Quadrant | BADHDUFLAG | Total packets | Discarded packets |
| A | 0 | 4646 | 0 |
| B | 0 | 4646 | 0 |
| C | 0 | 4646 | 0 |
| D | 0 | 4646 | 0 |
| Mode M9 | |||
|---|---|---|---|
| Quadrant | BADHDUFLAG | Total packets | Discarded packets |
| A | 0 | 370 | 0 |
| B | 0 | 370 | 0 |
| C | 0 | 370 | 0 |
| D | 0 | 370 | 0 |
| Mode M0 | |||
|---|---|---|---|
| Quadrant | BADHDUFLAG | Total packets | Discarded packets |
| A | 0 | 486806 | 0 |
| B | 0 | 534630 | 0 |
| C | 0 | 552445 | 0 |
| D | 0 | 610699 | 0 |
| Quadrant | Total seconds | Saturated seconds | Saturation percentage |
|---|---|---|---|
| A | 227902 | 2577 | 1.130749% |
| B | 227902 | 7355 | 3.227264% |
| C | 227902 | 11332 | 4.972313% |
| D | 227902 | 11262 | 4.941598% |
Noise dominated data is calculated using 1-second bins in cleaned event files. If a bin has >2000 counts, and if more than 50% of those come from <1% of pixels, then it is considered to be noise-dominated and hence unusable.
| Quadrant | # 1 sec bins | Bins with >0 counts | Bins with >2000 counts | High rate bins dominated by noise | Noise dominated (total time) | Noise dominated (detector-on time) | Marked lightcurve |
|---|---|---|---|---|---|---|---|
| A | 265022 | 227893 | 22 | 22 | 0.01% | 0.01% |  |
| B | 265022 | 227886 | 388 | 388 | 0.15% | 0.17% |  |
| C | 265022 | 227890 | 2391 | 2391 | 0.90% | 1.05% |  |
| D | 265022 | 227893 | 4185 | 4185 | 1.58% | 1.84% |  |
Top three noisy pixels from each quadrant. If the there are fewer than three noisy pixels in the level2.evt file, extra rows are filled as -1
| Pixel properties | Quadrant properties | ||||||
|---|---|---|---|---|---|---|---|
| Quadrant | DetID | PixID | Counts | Sigma | Mean | Median | Sigma |
| A | 13 | 248 | 518492 | 182.01 | 12943 | 12735 | 2778.8 |
| A | 15 | 174 | 404208 | 140.88 | 12943 | 12735 | 2778.8 |
| A | 14 | 235 | 373938 | 129.99 | 12943 | 12735 | 2778.8 |
| B | 3 | 64 | 4852973 | 2010.4 | 12825 | 12545 | 2407.7 |
| B | 5 | 172 | 3664583 | 1516.82 | 12825 | 12545 | 2407.7 |
| B | 7 | 205 | 2288854 | 945.43 | 12825 | 12545 | 2407.7 |
| C | 2 | 16 | 10728479 | 3853.89 | 11948 | 11932 | 2780.7 |
| C | 8 | 208 | 10668027 | 3832.15 | 11948 | 11932 | 2780.7 |
| C | 15 | 208 | 1059632 | 376.77 | 11948 | 11932 | 2780.7 |
| D | 1 | 52 | 28139016 | 9725.23 | 12155 | 11871 | 2892.2 |
| D | 2 | 250 | 5661572 | 1953.44 | 12155 | 11871 | 2892.2 |
| D | 12 | 227 | 2065830 | 710.18 | 12155 | 11871 | 2892.2 |
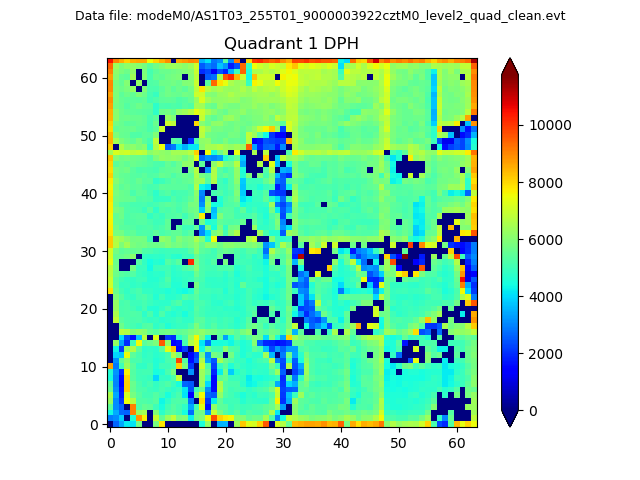
Histogram calculated using DETX and DETY for each event in the final _common_clean file
| Quadrant A |  |
 |
Quadrant B |
|---|---|---|---|
| Quadrant D | 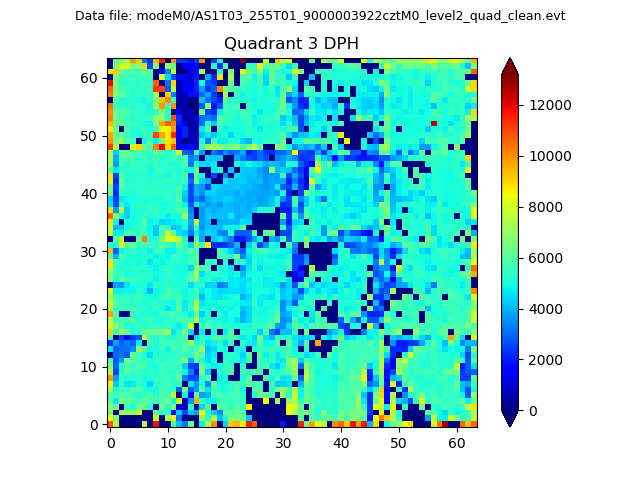 |
 |
Quadrant C |
| Plot type | Count rate plots | Images |
|---|---|---|
| Comparison with Poisson distribution Blue bars denote a histogram of data divided into 1 sec bins. Red curve is a Poisson curve with rate = median count rate of data. |
 |
 |
| Quadrant-wise count rates Data is divided into 100 sec bins |
 |
|
| Module-wise count rates for Quadrant A Data is divided into 100 sec bins |
 |
 |
| Module-wise count rates for Quadrant B Data is divided into 100 sec bins |
 |
 |
| Module-wise count rates for Quadrant C Data is divided into 100 sec bins |
 |
 |
| Module-wise count rates for Quadrant D Data is divided into 100 sec bins |
 |
 |
| Parameter | Plot |
|---|---|
| CZT HV Monitor |  |
| D_VDD |  |
| Temperature 1 |  |
| Veto HV Monitor |  |
| Veto LLD | 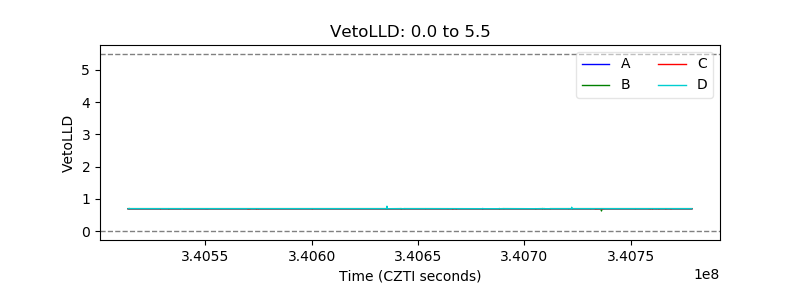 |
| Alpha Counter |  |
| _CPM_Rate |  |
| CZT Counter | 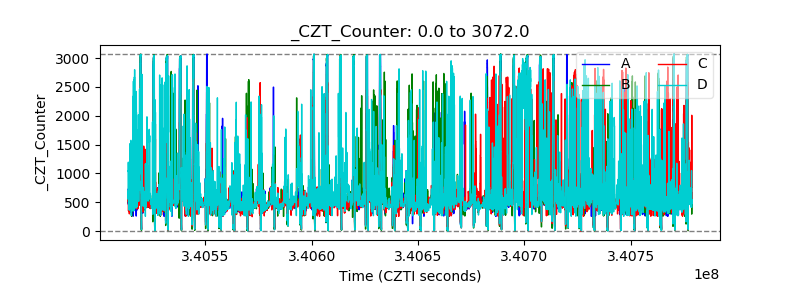 |
| +2.5 Volts monitor |  |
| +5 Volts monitor |  |
| _ROLL_ROT |  |
| _Roll_DEC | 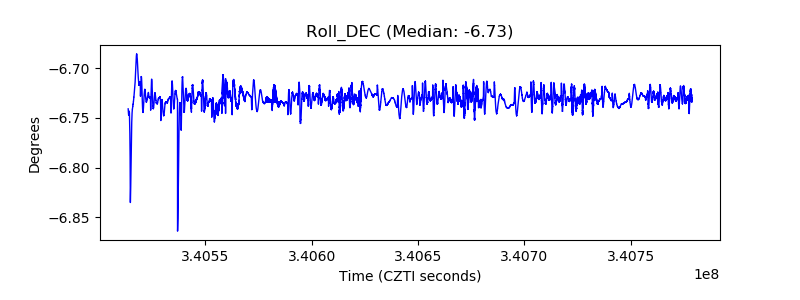 |
| _Roll_RA |  |
| Veto Counter |  |