| Param | Original file | Final file |
|---|---|---|
| Filename | modeM0/AS1C05_013T06_9000003920cztM0_level2_bc.evt | modeM0/AS1C05_013T06_9000003920cztM0_level2_quad_clean.evt |
| Size (bytes) | 792,426,240 | 374,443,200 |
| Size | 755.7 MB | 357.1 MB |
| Events in quadrant A | 4,182,348 | 2,512,412 |
| Events in quadrant B | 4,514,942 | 2,544,239 |
| Events in quadrant C | 4,024,084 | 2,459,102 |
| Events in quadrant D | 9,841,185 | 2,380,755 |
| Mode M0 | |||
|---|---|---|---|
| Quadrant | BADHDUFLAG | Total packets | Discarded packets |
| A | 0 | 42950 | 0 |
| B | 0 | 44297 | 0 |
| C | 0 | 42905 | 0 |
| D | 0 | 60656 | 0 |
| Mode M9 | |||
|---|---|---|---|
| Quadrant | BADHDUFLAG | Total packets | Discarded packets |
| A | 0 | 14 | 0 |
| B | 0 | 14 | 0 |
| C | 0 | 14 | 0 |
| D | 0 | 14 | 0 |
| Mode SS | |||
|---|---|---|---|
| Quadrant | BADHDUFLAG | Total packets | Discarded packets |
| A | 0 | 426 | 0 |
| B | 0 | 426 | 0 |
| C | 0 | 426 | 0 |
| D | 0 | 426 | 0 |
| Quadrant | Total seconds | Saturated seconds | Saturation percentage |
|---|---|---|---|
| A | 20997 | 69 | 0.328618% |
| B | 20997 | 210 | 1.000143% |
| C | 20997 | 201 | 0.957280% |
| D | 20997 | 951 | 4.529218% |
Noise dominated data is calculated using 1-second bins in cleaned event files. If a bin has >2000 counts, and if more than 50% of those come from <1% of pixels, then it is considered to be noise-dominated and hence unusable.
| Quadrant | # 1 sec bins | Bins with >0 counts | Bins with >2000 counts | High rate bins dominated by noise | Noise dominated (total time) | Noise dominated (detector-on time) | Marked lightcurve |
|---|---|---|---|---|---|---|---|
| A | 22447 | 20997 | 0 | 0 | 0.00% | 0.00% |  |
| B | 22447 | 20997 | 13 | 13 | 0.06% | 0.06% |  |
| C | 22447 | 20997 | 0 | 0 | 0.00% | 0.00% | 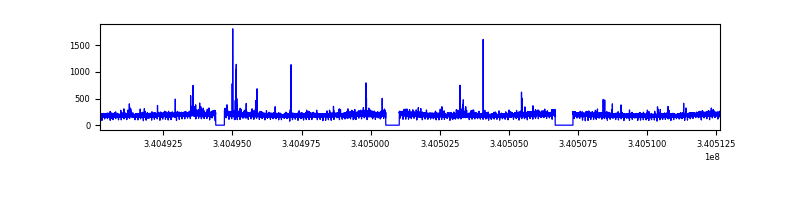 |
| D | 22447 | 20997 | 376 | 376 | 1.68% | 1.79% |  |
Top three noisy pixels from each quadrant. If the there are fewer than three noisy pixels in the level2.evt file, extra rows are filled as -1
| Pixel properties | Quadrant properties | ||||||
|---|---|---|---|---|---|---|---|
| Quadrant | DetID | PixID | Counts | Sigma | Mean | Median | Sigma |
| A | 13 | 248 | 48158 | 203.6 | 1061 | 1043 | 231.4 |
| A | 13 | 254 | 34293 | 143.68 | 1061 | 1043 | 231.4 |
| A | 13 | 252 | 17503 | 71.13 | 1061 | 1043 | 231.4 |
| B | 5 | 172 | 123033 | 593.79 | 1064 | 1036 | 205.5 |
| B | 10 | 245 | 92135 | 443.4 | 1064 | 1036 | 205.5 |
| B | 7 | 205 | 61685 | 295.2 | 1064 | 1036 | 205.5 |
| C | 2 | 16 | 32943 | 130.07 | 1027 | 1024 | 245.4 |
| C | 8 | 128 | 13231 | 49.74 | 1027 | 1024 | 245.4 |
| C | 15 | 208 | 10492 | 38.58 | 1027 | 1024 | 245.4 |
| D | 1 | 52 | 5110868 | 20582.46 | 1029 | 1001 | 248.3 |
| D | 2 | 250 | 249072 | 999.23 | 1029 | 1001 | 248.3 |
| D | 12 | 233 | 124701 | 498.26 | 1029 | 1001 | 248.3 |
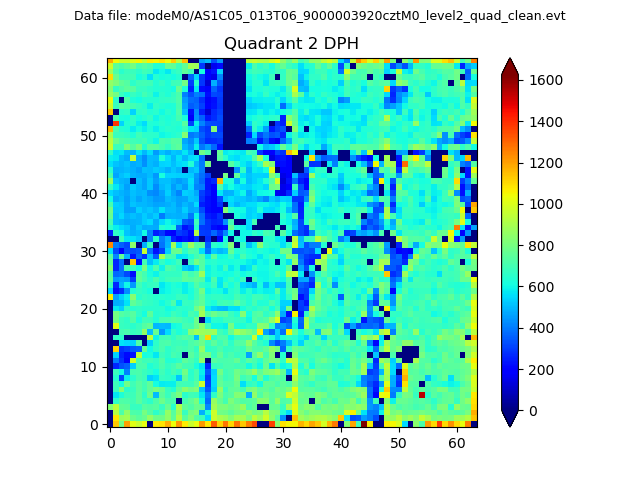
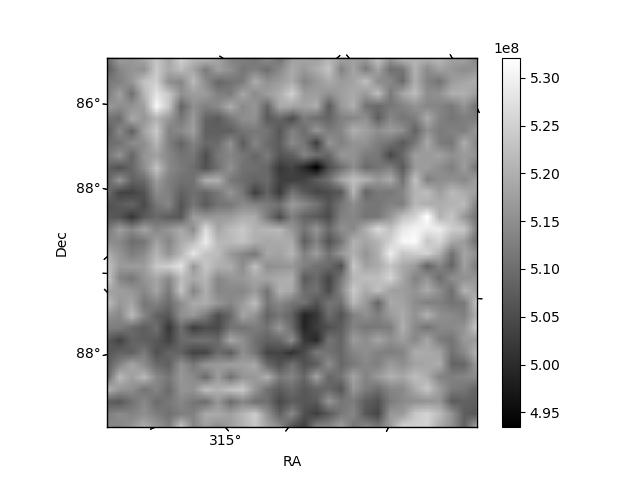
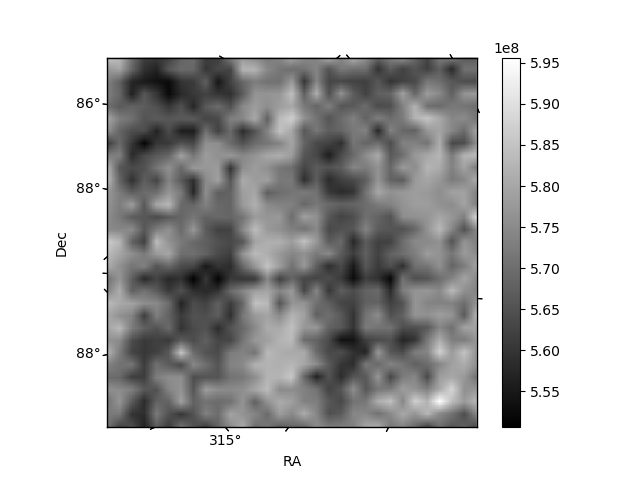
Histogram calculated using DETX and DETY for each event in the final _common_clean file
| Quadrant A | 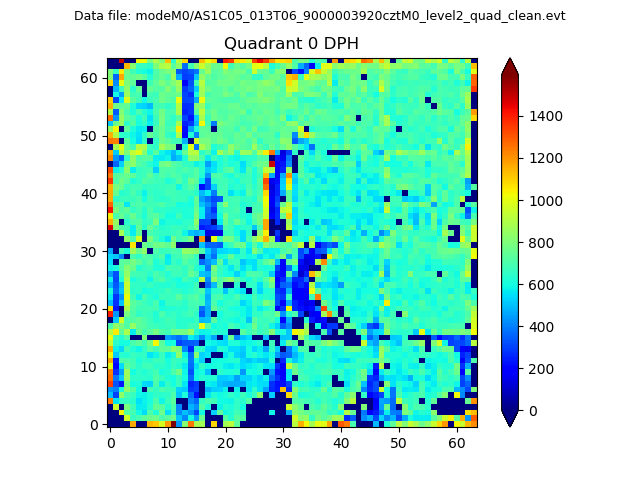 |
 |
Quadrant B |
|---|---|---|---|
| Quadrant D |  |
 |
Quadrant C |
| Plot type | Count rate plots | Images |
|---|---|---|
| Comparison with Poisson distribution Blue bars denote a histogram of data divided into 1 sec bins. Red curve is a Poisson curve with rate = median count rate of data. |
 |
 |
| Quadrant-wise count rates Data is divided into 100 sec bins |
 |
|
| Module-wise count rates for Quadrant A Data is divided into 100 sec bins |
 |
 |
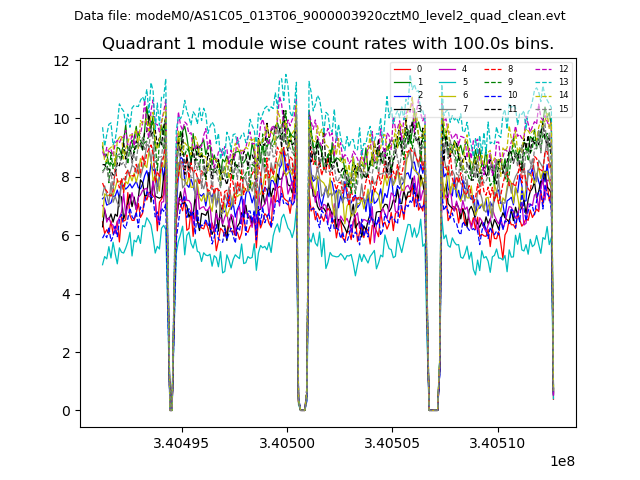
| Module-wise count rates for Quadrant B Data is divided into 100 sec bins |
 |
 |
| Module-wise count rates for Quadrant C Data is divided into 100 sec bins |
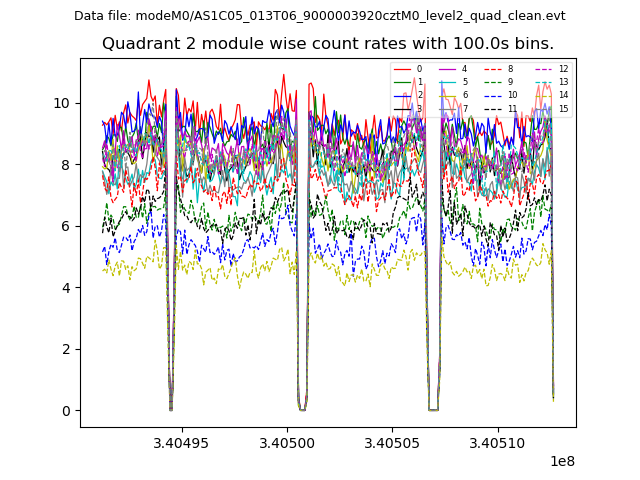 |
 |
| Module-wise count rates for Quadrant D Data is divided into 100 sec bins |
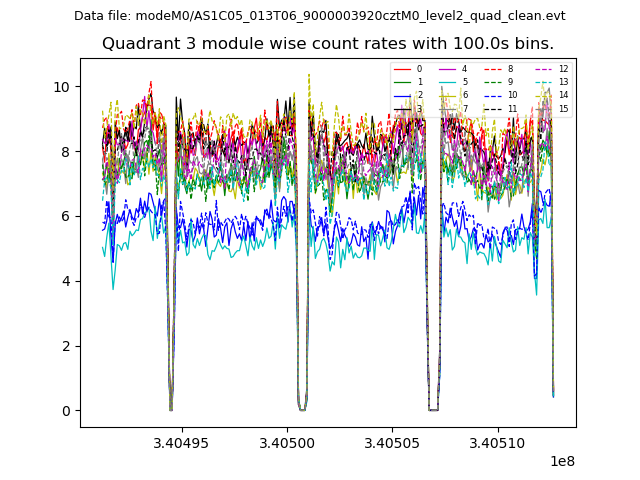 |
 |
| Parameter | Plot |
|---|---|
| CZT HV Monitor |  |
| D_VDD |  |
| Temperature 1 |  |
| Veto HV Monitor |  |
| Veto LLD |  |
| Alpha Counter |  |
| _CPM_Rate |  |
| CZT Counter |  |
| +2.5 Volts monitor |  |
| +5 Volts monitor |  |
| _ROLL_ROT |  |
| _Roll_DEC |  |
| _Roll_RA | 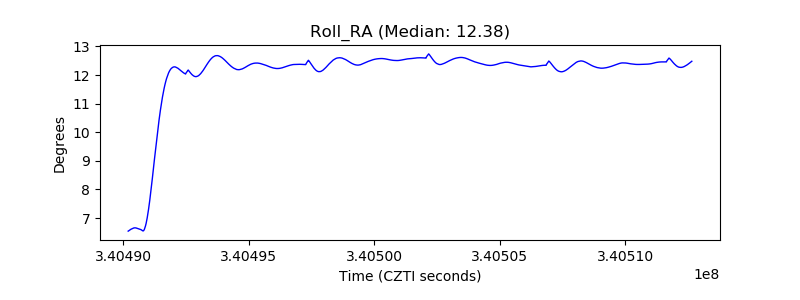 |
| Veto Counter |  |