| Param | Original file | Final file |
|---|---|---|
| Filename | modeM0/AS1T03_243T01_9000003918cztM0_level2_bc.evt | modeM0/AS1T03_243T01_9000003918cztM0_level2_quad_clean.evt |
| Size (bytes) | 16,164,904,320 | 5,002,577,280 |
| Size | 15.1 GB | 4.7 GB |
| Events in quadrant A | 94,839,532 | 32,766,447 |
| Events in quadrant B | 108,686,849 | 32,708,893 |
| Events in quadrant C | 81,965,173 | 31,621,720 |
| Events in quadrant D | 179,218,913 | 29,398,192 |
| Mode SS | |||
|---|---|---|---|
| Quadrant | BADHDUFLAG | Total packets | Discarded packets |
| A | 0 | 7490 | 0 |
| B | 0 | 7492 | 0 |
| C | 0 | 7492 | 0 |
| D | 0 | 7494 | 0 |
| Mode M9 | |||
|---|---|---|---|
| Quadrant | BADHDUFLAG | Total packets | Discarded packets |
| A | 0 | 573 | 0 |
| B | 0 | 586 | 0 |
| C | 0 | 573 | 0 |
| D | 0 | 586 | 0 |
| Mode M0 | |||
|---|---|---|---|
| Quadrant | BADHDUFLAG | Total packets | Discarded packets |
| A | 0 | 802234 | 0 |
| B | 0 | 868270 | 0 |
| C | 0 | 771947 | 0 |
| D | 0 | 1131300 | 0 |
| Quadrant | Total seconds | Saturated seconds | Saturation percentage |
|---|---|---|---|
| A | 365410 | 6863 | 1.878164% |
| B | 365422 | 14030 | 3.839397% |
| C | 365504 | 6535 | 1.787942% |
| D | 365179 | 33125 | 9.070894% |
Noise dominated data is calculated using 1-second bins in cleaned event files. If a bin has >2000 counts, and if more than 50% of those come from <1% of pixels, then it is considered to be noise-dominated and hence unusable.
| Quadrant | # 1 sec bins | Bins with >0 counts | Bins with >2000 counts | High rate bins dominated by noise | Noise dominated (total time) | Noise dominated (detector-on time) | Marked lightcurve |
|---|---|---|---|---|---|---|---|
| A | 429028 | 365787 | 1299 | 1299 | 0.30% | 0.36% |  |
| B | 429028 | 365771 | 1079 | 1079 | 0.25% | 0.29% | 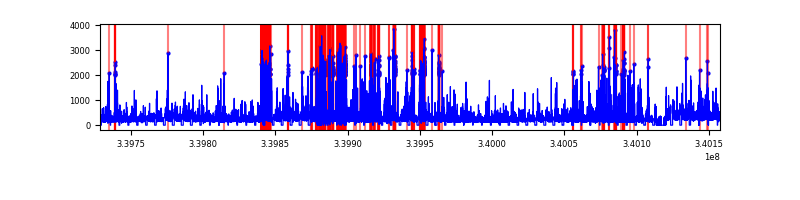 |
| C | 429027 | 365965 | 67 | 67 | 0.02% | 0.02% |  |
| D | 429027 | 365248 | 8008 | 8008 | 1.87% | 2.19% |  |
Top three noisy pixels from each quadrant. If the there are fewer than three noisy pixels in the level2.evt file, extra rows are filled as -1
| Pixel properties | Quadrant properties | ||||||
|---|---|---|---|---|---|---|---|
| Quadrant | DetID | PixID | Counts | Sigma | Mean | Median | Sigma |
| A | 6 | 16 | 8099830 | 1797.11 | 21590 | 21294 | 4495.3 |
| A | 14 | 235 | 1077949 | 235.06 | 21590 | 21294 | 4495.3 |
| A | 0 | 13 | 895379 | 194.44 | 21590 | 21294 | 4495.3 |
| B | 3 | 64 | 20481049 | 5248.51 | 21528 | 21097 | 3898.2 |
| B | 15 | 33 | 1391988 | 351.67 | 21528 | 21097 | 3898.2 |
| B | 0 | 190 | 836334 | 209.13 | 21528 | 21097 | 3898.2 |
| C | 15 | 208 | 1906610 | 366.73 | 20300 | 20501 | 5143.1 |
| C | 14 | 238 | 492714 | 91.82 | 20300 | 20501 | 5143.1 |
| C | 2 | 16 | 235045 | 41.72 | 20300 | 20501 | 5143.1 |
| D | 1 | 52 | 69468570 | 14618.92 | 20077 | 19631 | 4750.6 |
| D | 2 | 250 | 7491887 | 1572.9 | 20077 | 19631 | 4750.6 |
| D | 12 | 1 | 5772027 | 1210.87 | 20077 | 19631 | 4750.6 |
Histogram calculated using DETX and DETY for each event in the final _common_clean file
| Quadrant A | 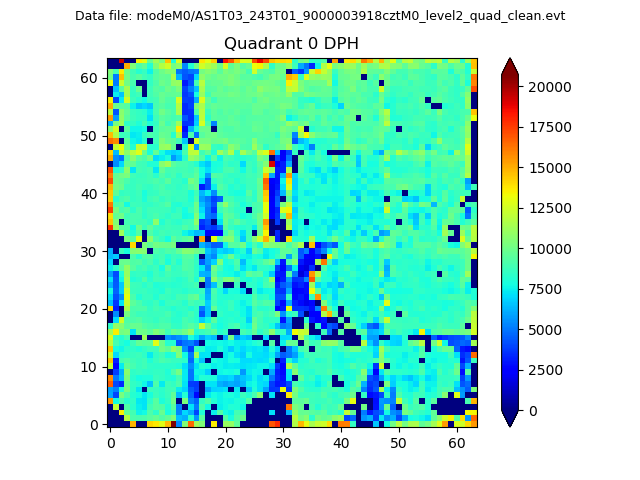 |
 |
Quadrant B |
|---|---|---|---|
| Quadrant D |  |
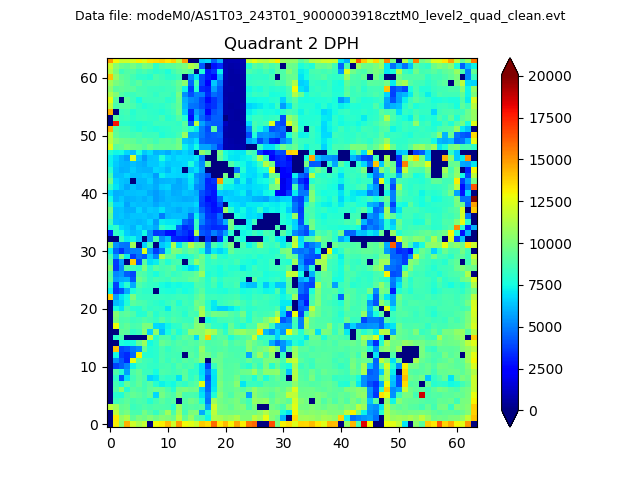 |
Quadrant C |
| Plot type | Count rate plots | Images |
|---|---|---|
| Comparison with Poisson distribution Blue bars denote a histogram of data divided into 1 sec bins. Red curve is a Poisson curve with rate = median count rate of data. |
 |
 |
| Quadrant-wise count rates Data is divided into 100 sec bins |
 |
|
| Module-wise count rates for Quadrant A Data is divided into 100 sec bins |
 |
 |
| Module-wise count rates for Quadrant B Data is divided into 100 sec bins |
 |
 |
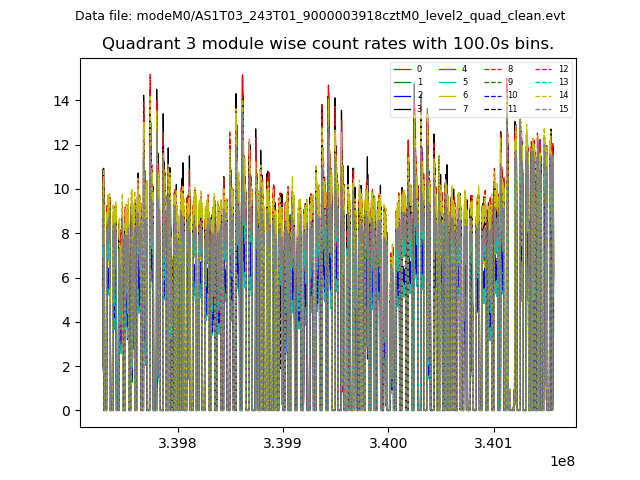
| Module-wise count rates for Quadrant C Data is divided into 100 sec bins |
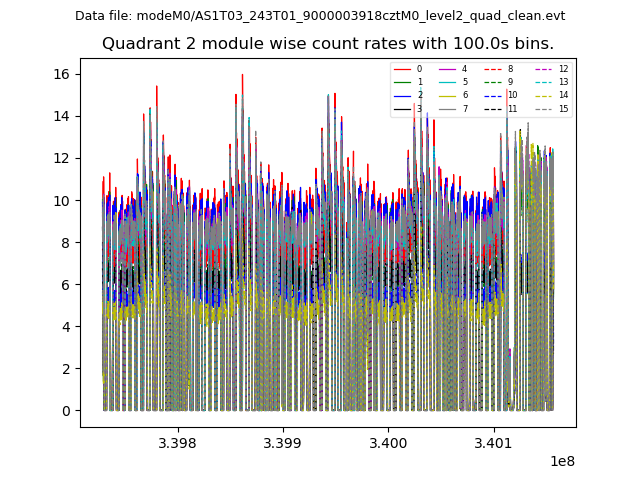 |
 |
| Module-wise count rates for Quadrant D Data is divided into 100 sec bins |
 |
 |
| Parameter | Plot |
|---|---|
| CZT HV Monitor | 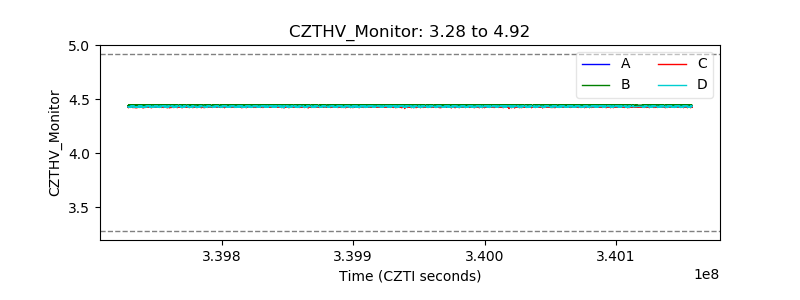 |
| D_VDD |  |
| Temperature 1 |  |
| Veto HV Monitor |  |
| Veto LLD |  |
| Alpha Counter |  |
| _CPM_Rate |  |
| CZT Counter |  |
| +2.5 Volts monitor |  |
| +5 Volts monitor |  |
| _ROLL_ROT |  |
| _Roll_DEC |  |
| _Roll_RA |  |
| Veto Counter |  |