| Param | Original file | Final file |
|---|---|---|
| Filename | modeM0/AS1T03_247T01_9000003914cztM0_level2_bc.evt | modeM0/AS1T03_247T01_9000003914cztM0_level2_quad_clean.evt |
| Size (bytes) | 654,762,240 | 335,462,400 |
| Size | 624.4 MB | 319.9 MB |
| Events in quadrant A | 4,033,051 | 2,236,043 |
| Events in quadrant B | 4,273,573 | 2,283,075 |
| Events in quadrant C | 3,809,505 | 2,198,272 |
| Events in quadrant D | 6,420,391 | 2,143,289 |
| Mode M9 | |||
|---|---|---|---|
| Quadrant | BADHDUFLAG | Total packets | Discarded packets |
| A | 0 | 10 | 0 |
| B | 0 | 10 | 0 |
| C | 0 | 10 | 0 |
| D | 0 | 10 | 0 |
| Mode M0 | |||
|---|---|---|---|
| Quadrant | BADHDUFLAG | Total packets | Discarded packets |
| A | 0 | 39208 | 0 |
| B | 0 | 39803 | 0 |
| C | 0 | 39214 | 0 |
| D | 0 | 47525 | 0 |
| Mode SS | |||
|---|---|---|---|
| Quadrant | BADHDUFLAG | Total packets | Discarded packets |
| A | 0 | 382 | 0 |
| B | 0 | 382 | 0 |
| C | 0 | 382 | 0 |
| D | 0 | 382 | 0 |
| Quadrant | Total seconds | Saturated seconds | Saturation percentage |
|---|---|---|---|
| A | 18886 | 158 | 0.836599% |
| B | 18886 | 212 | 1.122525% |
| C | 18886 | 260 | 1.376681% |
| D | 18886 | 418 | 2.213280% |
Noise dominated data is calculated using 1-second bins in cleaned event files. If a bin has >2000 counts, and if more than 50% of those come from <1% of pixels, then it is considered to be noise-dominated and hence unusable.
| Quadrant | # 1 sec bins | Bins with >0 counts | Bins with >2000 counts | High rate bins dominated by noise | Noise dominated (total time) | Noise dominated (detector-on time) | Marked lightcurve |
|---|---|---|---|---|---|---|---|
| A | 19886 | 18888 | 2 | 2 | 0.01% | 0.01% |  |
| B | 19886 | 18886 | 6 | 6 | 0.03% | 0.03% |  |
| C | 19886 | 18886 | 12 | 12 | 0.06% | 0.06% |  |
| D | 19886 | 18886 | 32 | 32 | 0.16% | 0.17% |  |
Top three noisy pixels from each quadrant. If the there are fewer than three noisy pixels in the level2.evt file, extra rows are filled as -1
| Pixel properties | Quadrant properties | ||||||
|---|---|---|---|---|---|---|---|
| Quadrant | DetID | PixID | Counts | Sigma | Mean | Median | Sigma |
| A | 14 | 235 | 228544 | 1084.15 | 955 | 936 | 209.9 |
| A | 13 | 34 | 62719 | 294.29 | 955 | 936 | 209.9 |
| A | 0 | 13 | 29080 | 134.06 | 955 | 936 | 209.9 |
| B | 3 | 112 | 283705 | 1511.26 | 967 | 942 | 187.1 |
| B | 3 | 64 | 90540 | 478.87 | 967 | 942 | 187.1 |
| B | 5 | 172 | 68504 | 361.09 | 967 | 942 | 187.1 |
| C | 15 | 208 | 156696 | 699.24 | 929 | 923 | 222.8 |
| C | 2 | 16 | 52472 | 231.4 | 929 | 923 | 222.8 |
| C | 8 | 222 | 14091 | 59.11 | 929 | 923 | 222.8 |
| D | 1 | 52 | 1323885 | 5623.22 | 933 | 907 | 235.3 |
| D | 7 | 38 | 606257 | 2573.0 | 933 | 907 | 235.3 |
| D | 2 | 250 | 391042 | 1658.24 | 933 | 907 | 235.3 |
Histogram calculated using DETX and DETY for each event in the final _common_clean file
| Quadrant A | 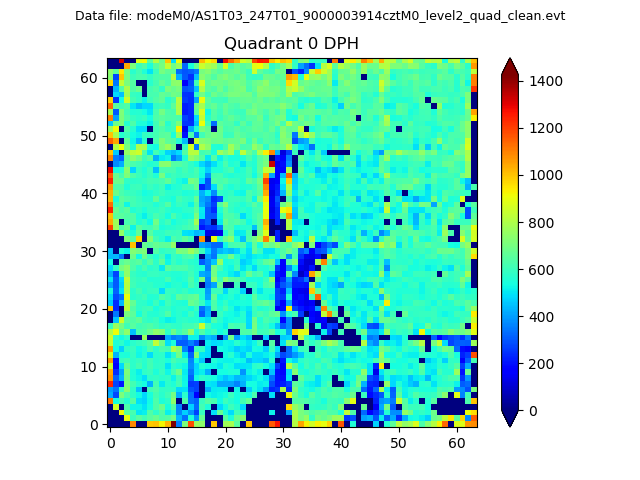 |
 |
Quadrant B |
|---|---|---|---|
| Quadrant D |  |
 |
Quadrant C |
| Plot type | Count rate plots | Images |
|---|---|---|
| Comparison with Poisson distribution Blue bars denote a histogram of data divided into 1 sec bins. Red curve is a Poisson curve with rate = median count rate of data. |
 |
 |
| Quadrant-wise count rates Data is divided into 100 sec bins |
 |
|
| Module-wise count rates for Quadrant A Data is divided into 100 sec bins |
 |
 |
| Module-wise count rates for Quadrant B Data is divided into 100 sec bins |
 |
 |
| Module-wise count rates for Quadrant C Data is divided into 100 sec bins |
 |
 |
| Module-wise count rates for Quadrant D Data is divided into 100 sec bins |
 |
 |
| Parameter | Plot |
|---|---|
| CZT HV Monitor |  |
| D_VDD |  |
| Temperature 1 |  |
| Veto HV Monitor |  |
| Veto LLD | 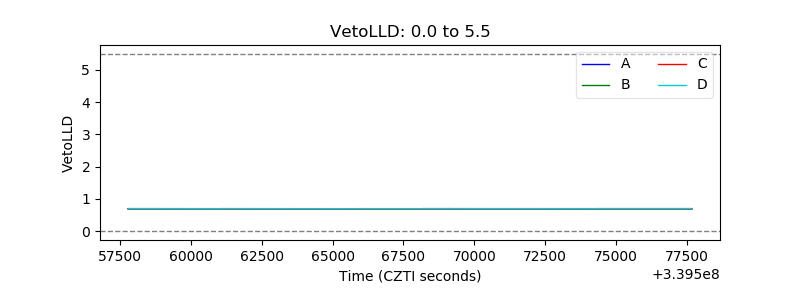 |
| Alpha Counter |  |
| _CPM_Rate | 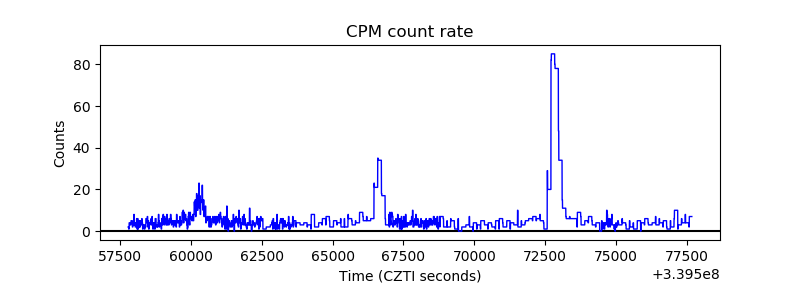 |
| CZT Counter |  |
| +2.5 Volts monitor |  |
| +5 Volts monitor |  |
| _ROLL_ROT |  |
| _Roll_DEC |  |
| _Roll_RA |  |
| Veto Counter |  |