| Param | Original file | Final file |
|---|---|---|
| Filename | modeM0/AS1T03_245T01_9000003916cztM0_level2_bc.evt | modeM0/AS1T03_245T01_9000003916cztM0_level2_quad_clean.evt |
| Size (bytes) | 5,267,134,080 | 1,707,603,840 |
| Size | 4.9 GB | 1.6 GB |
| Events in quadrant A | 34,385,478 | 11,000,278 |
| Events in quadrant B | 31,949,345 | 11,214,277 |
| Events in quadrant C | 26,115,327 | 10,740,368 |
| Events in quadrant D | 58,425,247 | 10,065,479 |
| Mode M0 | |||
|---|---|---|---|
| Quadrant | BADHDUFLAG | Total packets | Discarded packets |
| A | 0 | 288597 | 0 |
| B | 0 | 284842 | 0 |
| C | 0 | 265869 | 0 |
| D | 0 | 379449 | 0 |
| Mode SS | |||
|---|---|---|---|
| Quadrant | BADHDUFLAG | Total packets | Discarded packets |
| A | 0 | 2588 | 0 |
| B | 0 | 2588 | 0 |
| C | 0 | 2588 | 0 |
| D | 0 | 2588 | 0 |
| Mode M9 | |||
|---|---|---|---|
| Quadrant | BADHDUFLAG | Total packets | Discarded packets |
| A | 0 | 222 | 0 |
| B | 0 | 222 | 0 |
| C | 0 | 222 | 0 |
| D | 0 | 222 | 0 |
| Quadrant | Total seconds | Saturated seconds | Saturation percentage |
|---|---|---|---|
| A | 126988 | 3025 | 2.382115% |
| B | 126988 | 2329 | 1.834032% |
| C | 126988 | 2096 | 1.650550% |
| D | 126988 | 8788 | 6.920339% |
Noise dominated data is calculated using 1-second bins in cleaned event files. If a bin has >2000 counts, and if more than 50% of those come from <1% of pixels, then it is considered to be noise-dominated and hence unusable.
| Quadrant | # 1 sec bins | Bins with >0 counts | Bins with >2000 counts | High rate bins dominated by noise | Noise dominated (total time) | Noise dominated (detector-on time) | Marked lightcurve |
|---|---|---|---|---|---|---|---|
| A | 148667 | 126993 | 767 | 767 | 0.52% | 0.60% |  |
| B | 148667 | 126994 | 24 | 24 | 0.02% | 0.02% |  |
| C | 148667 | 126995 | 2 | 2 | 0.00% | 0.00% |  |
| D | 148667 | 126985 | 1693 | 1693 | 1.14% | 1.33% |  |
Top three noisy pixels from each quadrant. If the there are fewer than three noisy pixels in the level2.evt file, extra rows are filled as -1
| Pixel properties | Quadrant properties | ||||||
|---|---|---|---|---|---|---|---|
| Quadrant | DetID | PixID | Counts | Sigma | Mean | Median | Sigma |
| A | 6 | 16 | 4954279 | 3280.83 | 6991 | 6876 | 1508.0 |
| A | 0 | 13 | 1006759 | 663.07 | 6991 | 6876 | 1508.0 |
| A | 14 | 235 | 588059 | 385.41 | 6991 | 6876 | 1508.0 |
| B | 15 | 33 | 1453196 | 1089.97 | 7072 | 6901 | 1326.9 |
| B | 3 | 112 | 1097709 | 822.07 | 7072 | 6901 | 1326.9 |
| B | 5 | 172 | 538960 | 400.98 | 7072 | 6901 | 1326.9 |
| C | 15 | 208 | 261930 | 162.67 | 6690 | 6663 | 1569.2 |
| C | 2 | 16 | 58016 | 32.72 | 6690 | 6663 | 1569.2 |
| C | 4 | 224 | 38910 | 20.55 | 6690 | 6663 | 1569.2 |
| D | 1 | 52 | 22165716 | 13429.06 | 6551 | 6383 | 1650.1 |
| D | 7 | 38 | 4092067 | 2476.02 | 6551 | 6383 | 1650.1 |
| D | 2 | 250 | 2615803 | 1581.37 | 6551 | 6383 | 1650.1 |
Histogram calculated using DETX and DETY for each event in the final _common_clean file
| Quadrant A |  |
 |
Quadrant B |
|---|---|---|---|
| Quadrant D |  |
 |
Quadrant C |
| Plot type | Count rate plots | Images |
|---|---|---|
| Comparison with Poisson distribution Blue bars denote a histogram of data divided into 1 sec bins. Red curve is a Poisson curve with rate = median count rate of data. |
 |
 |
| Quadrant-wise count rates Data is divided into 100 sec bins |
 |
|
| Module-wise count rates for Quadrant A Data is divided into 100 sec bins |
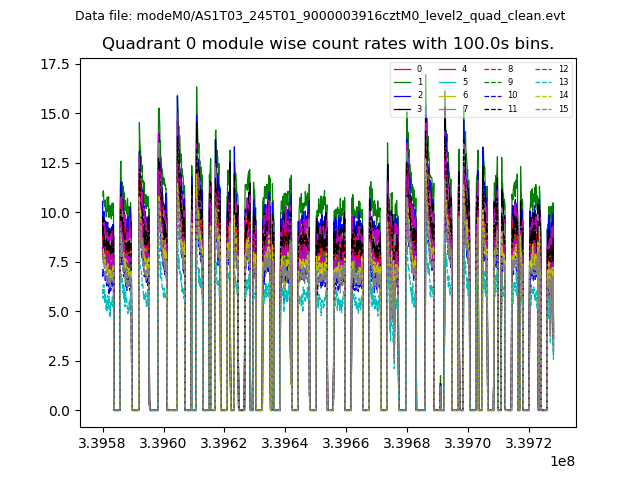 |
 |
| Module-wise count rates for Quadrant B Data is divided into 100 sec bins |
 |
 |
| Module-wise count rates for Quadrant C Data is divided into 100 sec bins |
 |
 |
| Module-wise count rates for Quadrant D Data is divided into 100 sec bins |
 |
 |
| Parameter | Plot |
|---|---|
| CZT HV Monitor |  |
| D_VDD |  |
| Temperature 1 | 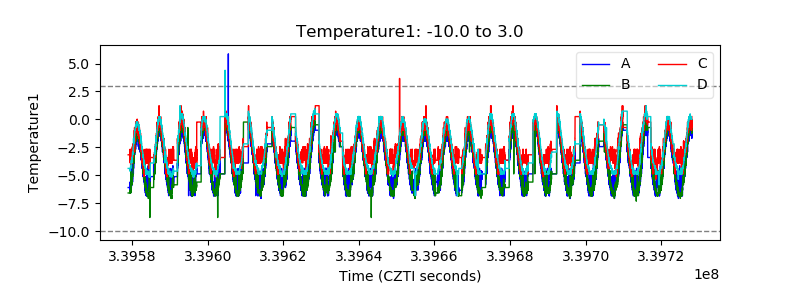 |
| Veto HV Monitor |  |
| Veto LLD |  |
| Alpha Counter |  |
| _CPM_Rate | 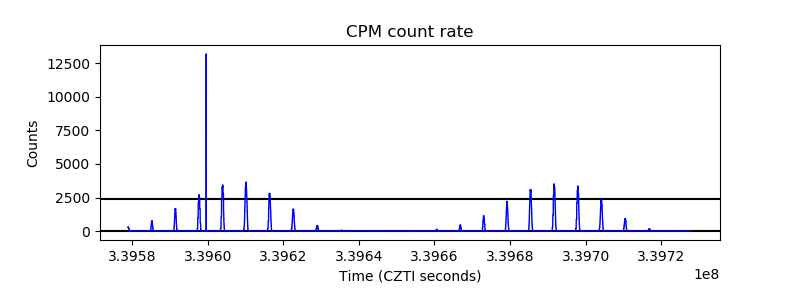 |
| CZT Counter |  |
| +2.5 Volts monitor |  |
| +5 Volts monitor |  |
| _ROLL_ROT |  |
| _Roll_DEC |  |
| _Roll_RA |  |
| Veto Counter |  |