| Param | Original file | Final file |
|---|---|---|
| Filename | modeM0/AS1T03_244T01_9000003912cztM0_level2_bc.evt | modeM0/AS1T03_244T01_9000003912cztM0_level2_quad_clean.evt |
| Size (bytes) | 8,193,294,720 | 2,517,888,960 |
| Size | 7.6 GB | 2.3 GB |
| Events in quadrant A | 52,128,291 | 16,414,335 |
| Events in quadrant B | 49,314,677 | 16,603,142 |
| Events in quadrant C | 39,080,752 | 15,970,440 |
| Events in quadrant D | 95,063,520 | 14,635,267 |
| Mode SS | |||
|---|---|---|---|
| Quadrant | BADHDUFLAG | Total packets | Discarded packets |
| A | 0 | 3766 | 0 |
| B | 0 | 3766 | 0 |
| C | 0 | 3766 | 0 |
| D | 0 | 3766 | 0 |
| Mode M9 | |||
|---|---|---|---|
| Quadrant | BADHDUFLAG | Total packets | Discarded packets |
| A | 0 | 308 | 0 |
| B | 0 | 308 | 0 |
| C | 0 | 308 | 0 |
| D | 0 | 308 | 0 |
| Mode M0 | |||
|---|---|---|---|
| Quadrant | BADHDUFLAG | Total packets | Discarded packets |
| A | 0 | 431099 | 0 |
| B | 0 | 418039 | 0 |
| C | 0 | 388709 | 0 |
| D | 0 | 590120 | 0 |
| Quadrant | Total seconds | Saturated seconds | Saturation percentage |
|---|---|---|---|
| A | 184502 | 3632 | 1.968542% |
| B | 184502 | 4270 | 2.314338% |
| C | 184502 | 2968 | 1.608655% |
| D | 184502 | 18177 | 9.851926% |
Noise dominated data is calculated using 1-second bins in cleaned event files. If a bin has >2000 counts, and if more than 50% of those come from <1% of pixels, then it is considered to be noise-dominated and hence unusable.
| Quadrant | # 1 sec bins | Bins with >0 counts | Bins with >2000 counts | High rate bins dominated by noise | Noise dominated (total time) | Noise dominated (detector-on time) | Marked lightcurve |
|---|---|---|---|---|---|---|---|
| A | 215637 | 184510 | 174 | 174 | 0.08% | 0.09% |  |
| B | 215637 | 184507 | 237 | 237 | 0.11% | 0.13% |  |
| C | 215637 | 184507 | 9 | 9 | 0.00% | 0.00% |  |
| D | 215637 | 184502 | 5520 | 5520 | 2.56% | 2.99% |  |
Top three noisy pixels from each quadrant. If the there are fewer than three noisy pixels in the level2.evt file, extra rows are filled as -1
| Pixel properties | Quadrant properties | ||||||
|---|---|---|---|---|---|---|---|
| Quadrant | DetID | PixID | Counts | Sigma | Mean | Median | Sigma |
| A | 14 | 235 | 6822783 | 3165.1 | 10105 | 9958 | 2152.5 |
| A | 6 | 16 | 5294814 | 2455.24 | 10105 | 9958 | 2152.5 |
| A | 12 | 189 | 399874 | 181.15 | 10105 | 9958 | 2152.5 |
| B | 10 | 245 | 5398499 | 2853.3 | 10195 | 9968 | 1888.5 |
| B | 3 | 112 | 1583310 | 833.11 | 10195 | 9968 | 1888.5 |
| B | 0 | 189 | 1272703 | 668.64 | 10195 | 9968 | 1888.5 |
| C | 15 | 208 | 779037 | 332.87 | 9806 | 9782 | 2311.0 |
| C | 2 | 16 | 366381 | 154.3 | 9806 | 9782 | 2311.0 |
| C | 3 | 233 | 109740 | 43.25 | 9806 | 9782 | 2311.0 |
| D | 1 | 52 | 43433036 | 18162.46 | 9483 | 9244 | 2390.9 |
| D | 7 | 38 | 7904598 | 3302.32 | 9483 | 9244 | 2390.9 |
| D | 2 | 250 | 4091754 | 1707.55 | 9483 | 9244 | 2390.9 |
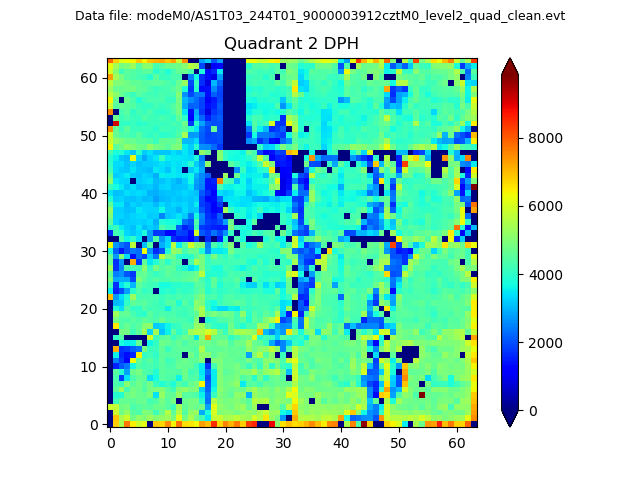
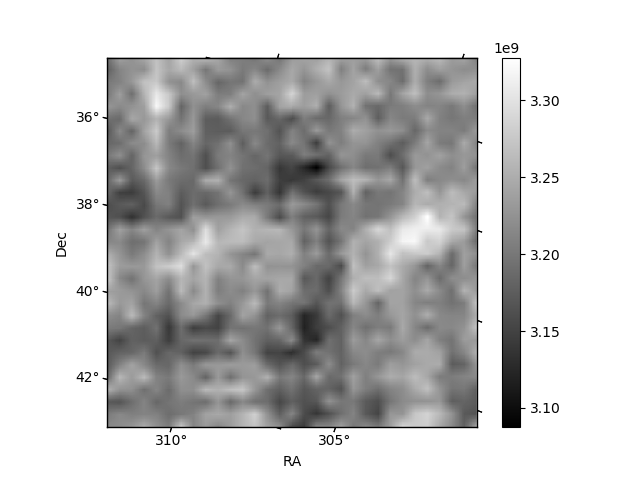
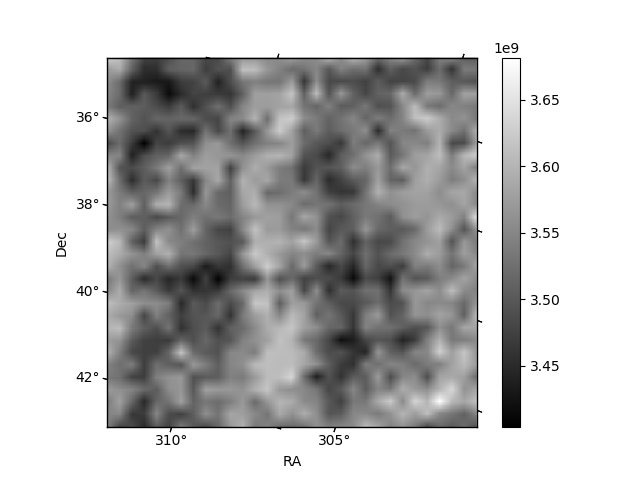
Histogram calculated using DETX and DETY for each event in the final _common_clean file
| Quadrant A |  |
 |
Quadrant B |
|---|---|---|---|
| Quadrant D | 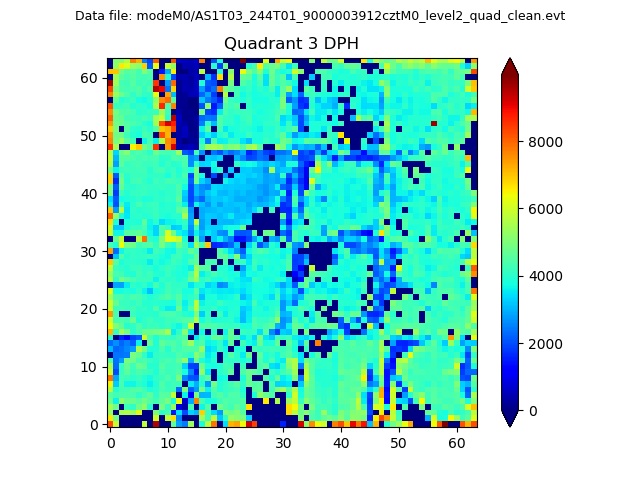 |
 |
Quadrant C |
| Plot type | Count rate plots | Images |
|---|---|---|
| Comparison with Poisson distribution Blue bars denote a histogram of data divided into 1 sec bins. Red curve is a Poisson curve with rate = median count rate of data. |
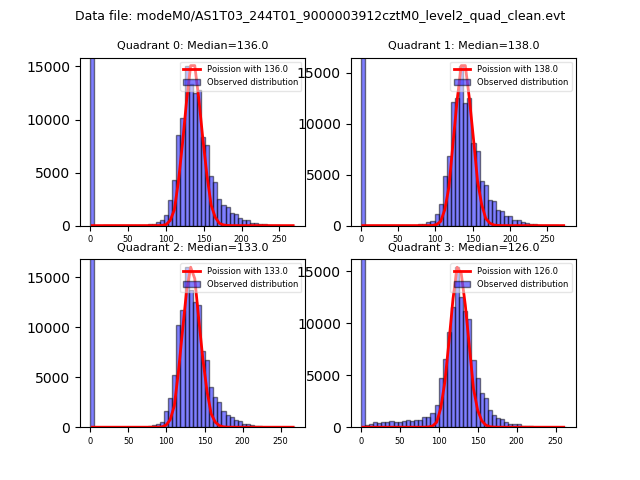 |
 |
| Quadrant-wise count rates Data is divided into 100 sec bins |
 |
|
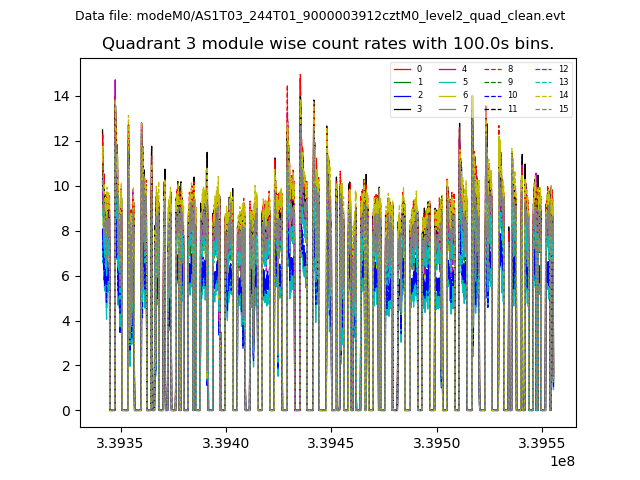
| Module-wise count rates for Quadrant A Data is divided into 100 sec bins |
 |
 |
| Module-wise count rates for Quadrant B Data is divided into 100 sec bins |
 |
 |
| Module-wise count rates for Quadrant C Data is divided into 100 sec bins |
 |
 |
| Module-wise count rates for Quadrant D Data is divided into 100 sec bins |
 |
 |
| Parameter | Plot |
|---|---|
| CZT HV Monitor |  |
| D_VDD |  |
| Temperature 1 |  |
| Veto HV Monitor |  |
| Veto LLD | 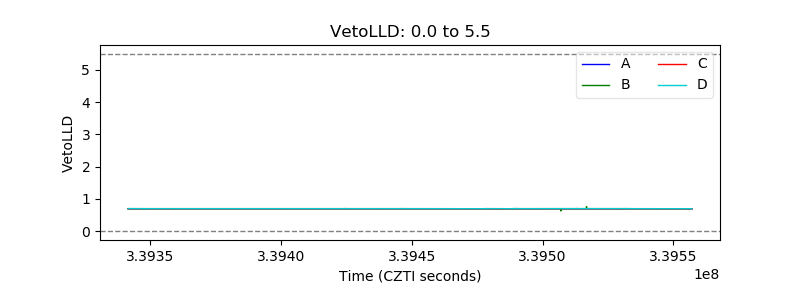 |
| Alpha Counter | 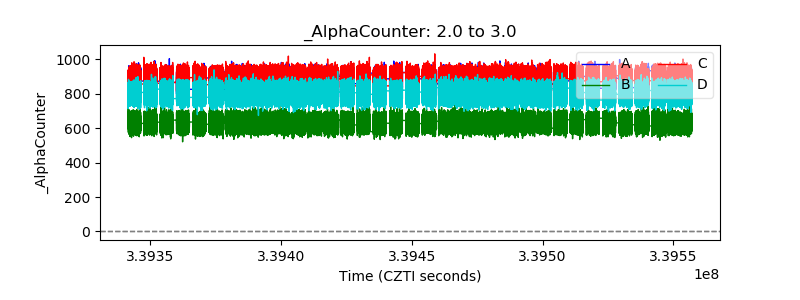 |
| _CPM_Rate |  |
| CZT Counter |  |
| +2.5 Volts monitor |  |
| +5 Volts monitor | 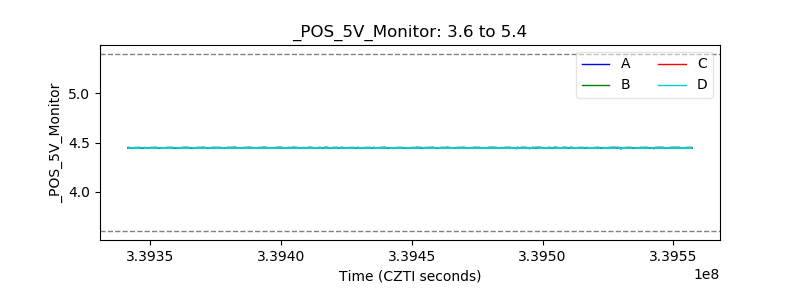 |
| _ROLL_ROT | 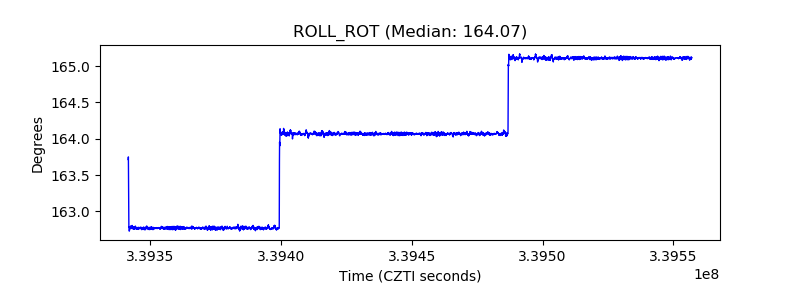 |
| _Roll_DEC | 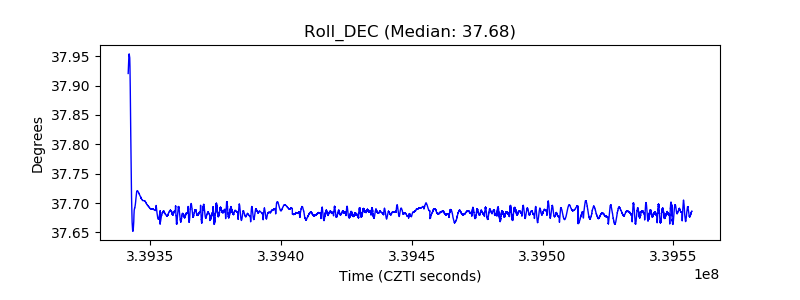 |
| _Roll_RA |  |
| Veto Counter |  |