| Param | Original file | Final file |
|---|---|---|
| Filename | modeM0/AS1T03_240T01_9000003906cztM0_level2_bc.evt | modeM0/AS1T03_240T01_9000003906cztM0_level2_quad_clean.evt |
| Size (bytes) | 301,155,840 | 115,104,960 |
| Size | 287.2 MB | 109.8 MB |
| Events in quadrant A | 1,640,838 | 770,405 |
| Events in quadrant B | 1,433,928 | 795,799 |
| Events in quadrant C | 1,183,851 | 767,307 |
| Events in quadrant D | 4,429,367 | 716,360 |
| Mode M9 | |||
|---|---|---|---|
| Quadrant | BADHDUFLAG | Total packets | Discarded packets |
| A | 0 | 5 | 0 |
| B | 0 | 5 | 0 |
| C | 0 | 5 | 0 |
| D | 0 | 5 | 0 |
| Mode M0 | |||
|---|---|---|---|
| Quadrant | BADHDUFLAG | Total packets | Discarded packets |
| A | 0 | 14142 | 0 |
| B | 0 | 13269 | 0 |
| C | 0 | 12672 | 0 |
| D | 0 | 22656 | 0 |
| Mode SS | |||
|---|---|---|---|
| Quadrant | BADHDUFLAG | Total packets | Discarded packets |
| A | 0 | 126 | 0 |
| B | 0 | 126 | 0 |
| C | 0 | 126 | 0 |
| D | 0 | 126 | 0 |
| Quadrant | Total seconds | Saturated seconds | Saturation percentage |
|---|---|---|---|
| A | 6252 | 119 | 1.903391% |
| B | 6252 | 100 | 1.599488% |
| C | 6252 | 48 | 0.767754% |
| D | 6252 | 498 | 7.965451% |
Noise dominated data is calculated using 1-second bins in cleaned event files. If a bin has >2000 counts, and if more than 50% of those come from <1% of pixels, then it is considered to be noise-dominated and hence unusable.
| Quadrant | # 1 sec bins | Bins with >0 counts | Bins with >2000 counts | High rate bins dominated by noise | Noise dominated (total time) | Noise dominated (detector-on time) | Marked lightcurve |
|---|---|---|---|---|---|---|---|
| A | 6702 | 6252 | 0 | 0 | 0.00% | 0.00% |  |
| B | 6702 | 6252 | 40 | 40 | 0.60% | 0.64% |  |
| C | 6702 | 6252 | 0 | 0 | 0.00% | 0.00% |  |
| D | 6702 | 6252 | 200 | 200 | 2.98% | 3.20% |  |
Top three noisy pixels from each quadrant. If the there are fewer than three noisy pixels in the level2.evt file, extra rows are filled as -1
| Pixel properties | Quadrant properties | ||||||
|---|---|---|---|---|---|---|---|
| Quadrant | DetID | PixID | Counts | Sigma | Mean | Median | Sigma |
| A | 14 | 235 | 413919 | 5915.7 | 309 | 303 | 69.9 |
| A | 6 | 16 | 24137 | 340.88 | 309 | 303 | 69.9 |
| A | 13 | 254 | 10041 | 139.28 | 309 | 303 | 69.9 |
| B | 0 | 189 | 207581 | 3295.85 | 315 | 307 | 62.9 |
| B | 0 | 219 | 11691 | 181.02 | 315 | 307 | 62.9 |
| B | 3 | 112 | 5724 | 86.14 | 315 | 307 | 62.9 |
| C | 15 | 208 | 7211 | 92.93 | 305 | 303 | 74.3 |
| C | 2 | 16 | 2242 | 26.08 | 305 | 303 | 74.3 |
| C | 13 | 61 | 1773 | 19.78 | 305 | 303 | 74.3 |
| D | 1 | 52 | 3154182 | 43641.85 | 299 | 289 | 72.3 |
| D | 2 | 250 | 90414 | 1247.1 | 299 | 289 | 72.3 |
| D | 2 | 234 | 26844 | 367.45 | 299 | 289 | 72.3 |
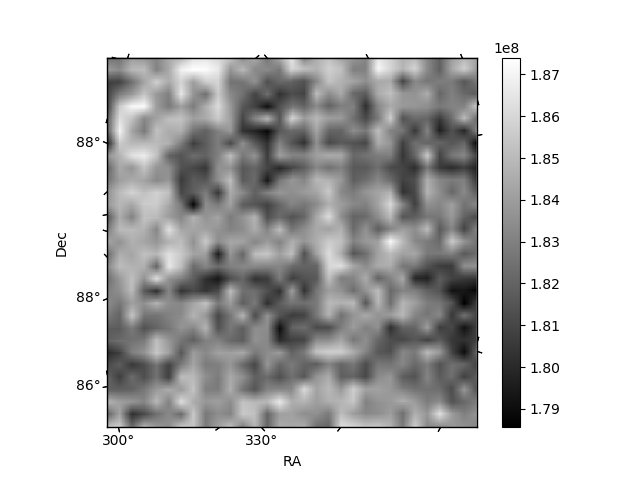
Histogram calculated using DETX and DETY for each event in the final _common_clean file
| Quadrant A | 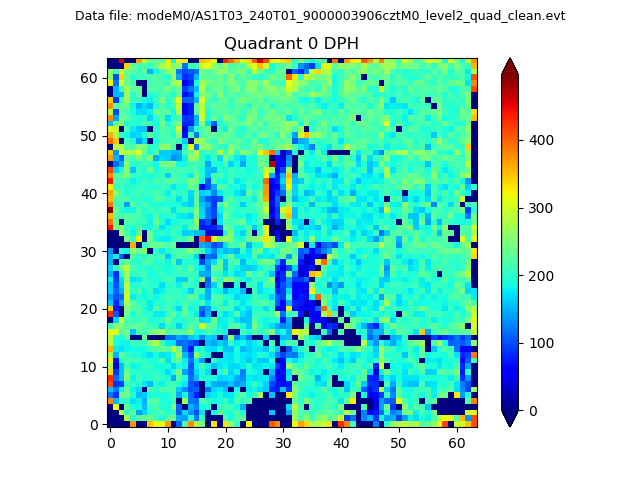 |
 |
Quadrant B |
|---|---|---|---|
| Quadrant D |  |
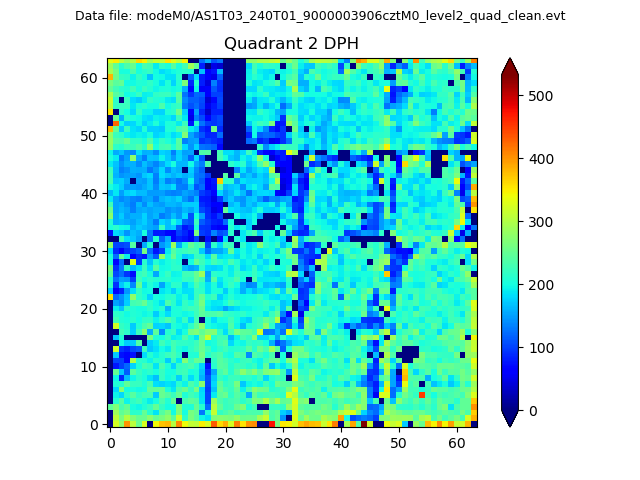 |
Quadrant C |
| Plot type | Count rate plots | Images |
|---|---|---|
| Comparison with Poisson distribution Blue bars denote a histogram of data divided into 1 sec bins. Red curve is a Poisson curve with rate = median count rate of data. |
 |
 |
| Quadrant-wise count rates Data is divided into 100 sec bins |
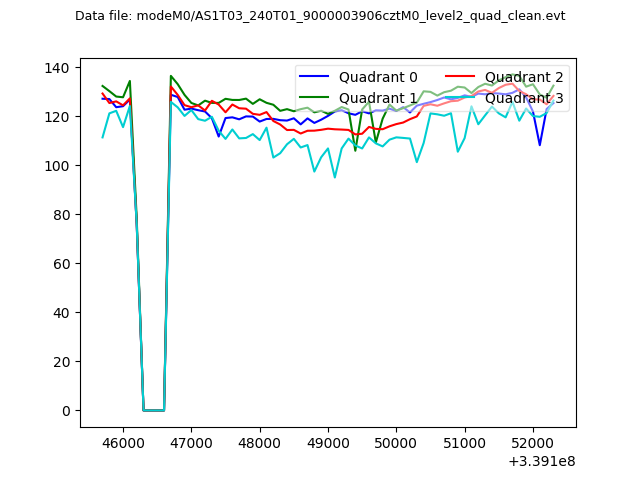 |
|
| Module-wise count rates for Quadrant A Data is divided into 100 sec bins |
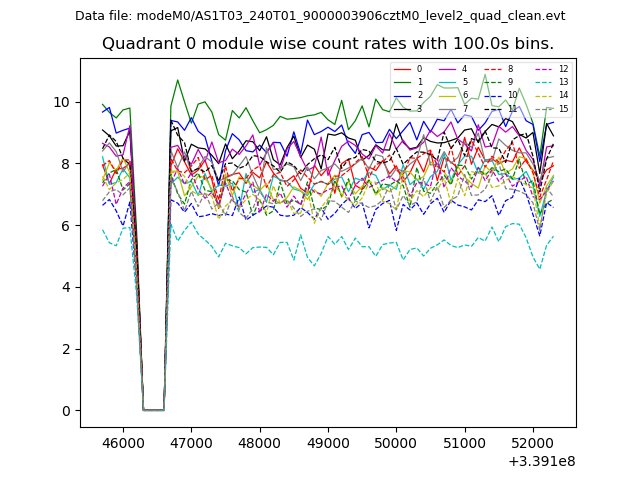 |
 |
| Module-wise count rates for Quadrant B Data is divided into 100 sec bins |
 |
 |
| Module-wise count rates for Quadrant C Data is divided into 100 sec bins |
 |
 |
| Module-wise count rates for Quadrant D Data is divided into 100 sec bins |
 |
 |
| Parameter | Plot |
|---|---|
| CZT HV Monitor | 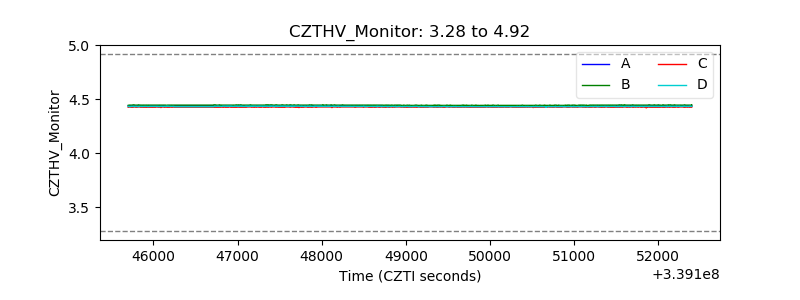 |
| D_VDD |  |
| Temperature 1 | 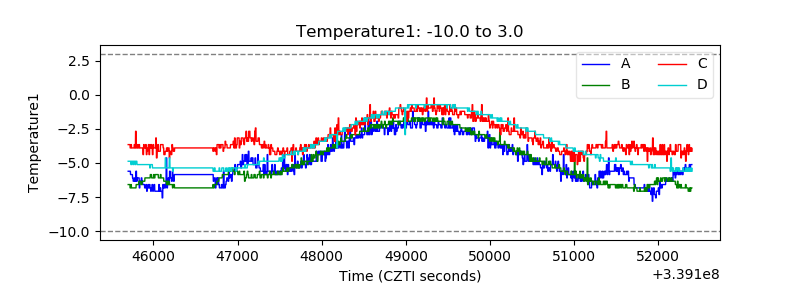 |
| Veto HV Monitor |  |
| Veto LLD |  |
| Alpha Counter |  |
| _CPM_Rate |  |
| CZT Counter |  |
| +2.5 Volts monitor |  |
| +5 Volts monitor | 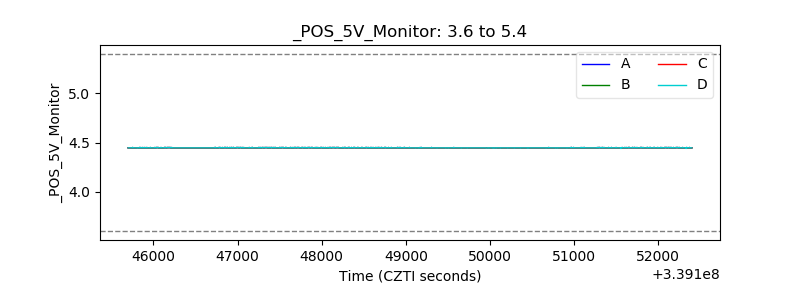 |
| _ROLL_ROT |  |
| _Roll_DEC | 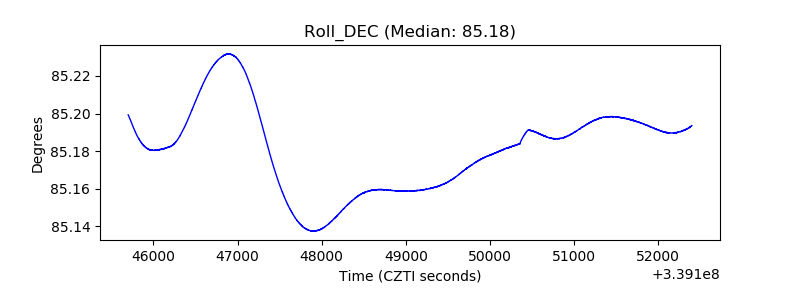 |
| _Roll_RA | 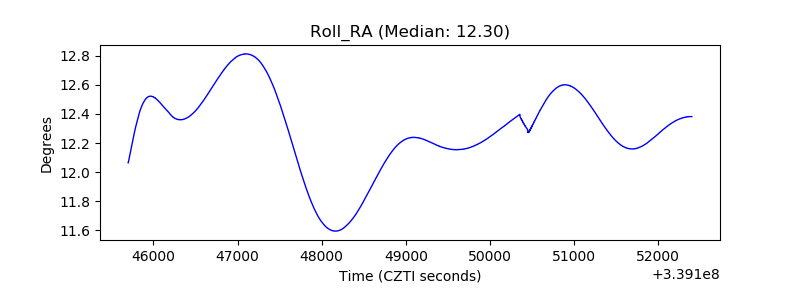 |
| Veto Counter | 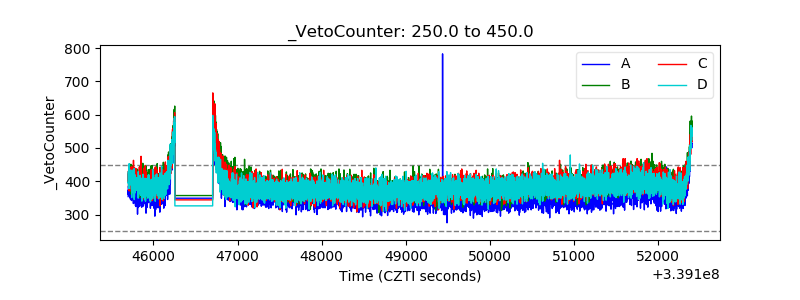 |