| Param | Original file | Final file |
|---|---|---|
| Filename | modeM0/AS1T03_236T01_9000003908cztM0_level2_bc.evt | modeM0/AS1T03_236T01_9000003908cztM0_level2_quad_clean.evt |
| Size (bytes) | 2,036,370,240 | 605,076,480 |
| Size | 1.9 GB | 577.0 MB |
| Events in quadrant A | 13,633,829 | 3,809,261 |
| Events in quadrant B | 15,380,793 | 3,904,619 |
| Events in quadrant C | 9,509,021 | 3,948,192 |
| Events in quadrant D | 20,205,793 | 3,699,189 |
| Mode M0 | |||
|---|---|---|---|
| Quadrant | BADHDUFLAG | Total packets | Discarded packets |
| A | 0 | 109316 | 0 |
| B | 0 | 111360 | 0 |
| C | 0 | 92950 | 0 |
| D | 0 | 129631 | 0 |
| Mode M9 | |||
|---|---|---|---|
| Quadrant | BADHDUFLAG | Total packets | Discarded packets |
| A | 0 | 95 | 0 |
| B | 0 | 96 | 0 |
| C | 0 | 96 | 0 |
| D | 0 | 96 | 0 |
| Mode SS | |||
|---|---|---|---|
| Quadrant | BADHDUFLAG | Total packets | Discarded packets |
| A | 0 | 880 | 0 |
| B | 0 | 880 | 0 |
| C | 0 | 880 | 0 |
| D | 0 | 880 | 0 |
| Quadrant | Total seconds | Saturated seconds | Saturation percentage |
|---|---|---|---|
| A | 43201 | 1282 | 2.967524% |
| B | 43201 | 2542 | 5.884123% |
| C | 43201 | 711 | 1.645795% |
| D | 43201 | 2658 | 6.152635% |
Noise dominated data is calculated using 1-second bins in cleaned event files. If a bin has >2000 counts, and if more than 50% of those come from <1% of pixels, then it is considered to be noise-dominated and hence unusable.
| Quadrant | # 1 sec bins | Bins with >0 counts | Bins with >2000 counts | High rate bins dominated by noise | Noise dominated (total time) | Noise dominated (detector-on time) | Marked lightcurve |
|---|---|---|---|---|---|---|---|
| A | 56590 | 43202 | 0 | 0 | 0.00% | 0.00% |  |
| B | 56590 | 43202 | 714 | 714 | 1.26% | 1.65% |  |
| C | 56590 | 43201 | 0 | 0 | 0.00% | 0.00% |  |
| D | 56590 | 43201 | 451 | 451 | 0.80% | 1.04% | 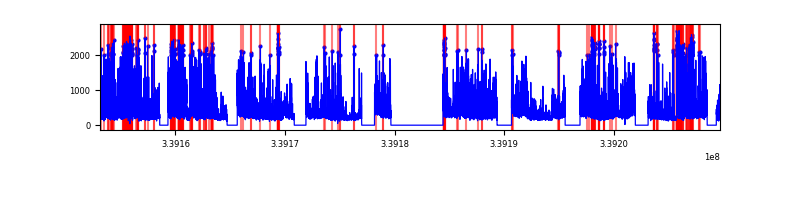 |
Top three noisy pixels from each quadrant. If the there are fewer than three noisy pixels in the level2.evt file, extra rows are filled as -1
| Pixel properties | Quadrant properties | ||||||
|---|---|---|---|---|---|---|---|
| Quadrant | DetID | PixID | Counts | Sigma | Mean | Median | Sigma |
| A | 14 | 235 | 4052714 | 7904.83 | 2415 | 2377 | 512.4 |
| A | 6 | 16 | 123960 | 237.29 | 2415 | 2377 | 512.4 |
| A | 12 | 189 | 121095 | 231.7 | 2415 | 2377 | 512.4 |
| B | 0 | 189 | 5014509 | 11042.86 | 2445 | 2397 | 453.9 |
| B | 3 | 112 | 788539 | 1732.05 | 2445 | 2397 | 453.9 |
| B | 0 | 219 | 85582 | 183.28 | 2445 | 2397 | 453.9 |
| C | 15 | 208 | 104162 | 178.61 | 2435 | 2429 | 569.6 |
| C | 2 | 16 | 24623 | 38.97 | 2435 | 2429 | 569.6 |
| C | 4 | 224 | 16730 | 25.11 | 2435 | 2429 | 569.6 |
| D | 1 | 52 | 10039191 | 18520.05 | 2386 | 2314 | 541.9 |
| D | 2 | 250 | 863373 | 1588.83 | 2386 | 2314 | 541.9 |
| D | 2 | 234 | 176541 | 321.48 | 2386 | 2314 | 541.9 |
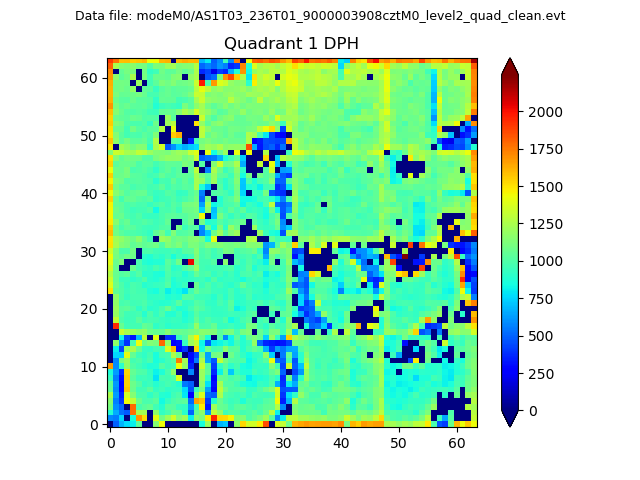
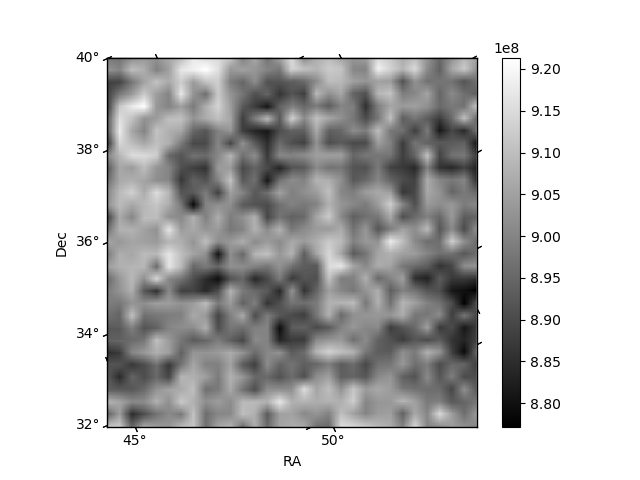
Histogram calculated using DETX and DETY for each event in the final _common_clean file
| Quadrant A |  |
 |
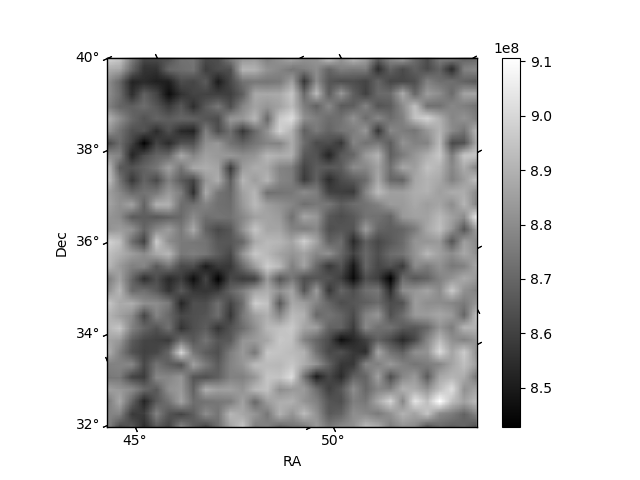
Quadrant B |
|---|---|---|---|
| Quadrant D |  |
 |
Quadrant C |
| Plot type | Count rate plots | Images |
|---|---|---|
| Comparison with Poisson distribution Blue bars denote a histogram of data divided into 1 sec bins. Red curve is a Poisson curve with rate = median count rate of data. |
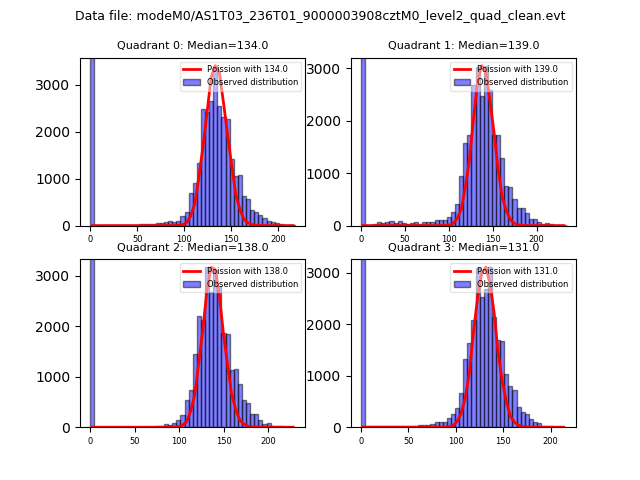 |
 |
| Quadrant-wise count rates Data is divided into 100 sec bins |
 |
|
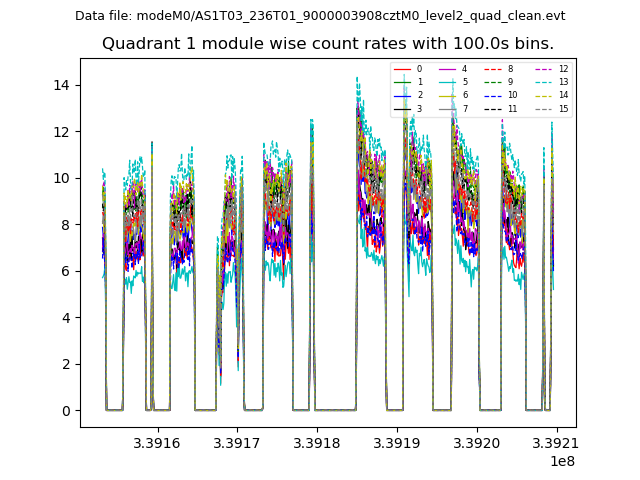
| Module-wise count rates for Quadrant A Data is divided into 100 sec bins |
 |
 |
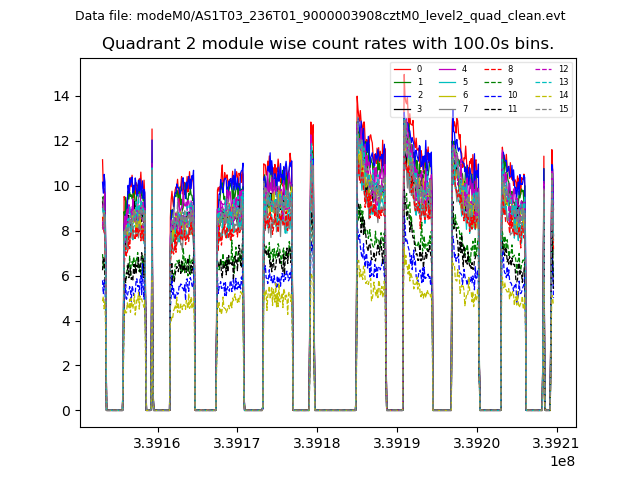
| Module-wise count rates for Quadrant B Data is divided into 100 sec bins |
 |
 |
| Module-wise count rates for Quadrant C Data is divided into 100 sec bins |
 |
 |
| Module-wise count rates for Quadrant D Data is divided into 100 sec bins |
 |
 |
| Parameter | Plot |
|---|---|
| CZT HV Monitor |  |
| D_VDD |  |
| Temperature 1 |  |
| Veto HV Monitor |  |
| Veto LLD |  |
| Alpha Counter |  |
| _CPM_Rate |  |
| CZT Counter |  |
| +2.5 Volts monitor |  |
| +5 Volts monitor |  |
| _ROLL_ROT |  |
| _Roll_DEC |  |
| _Roll_RA | 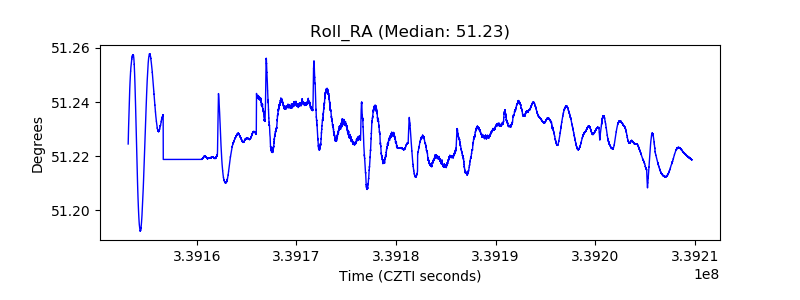 |
| Veto Counter |  |