| Param | Original file | Final file |
|---|---|---|
| Filename | modeM0/AS1T03_241T01_9000003902cztM0_level2_bc.evt | modeM0/AS1T03_241T01_9000003902cztM0_level2_quad_clean.evt |
| Size (bytes) | 477,682,560 | 188,280,000 |
| Size | 455.6 MB | 179.6 MB |
| Events in quadrant A | 6,032,376 | 1,056,748 |
| Events in quadrant B | 2,398,846 | 1,360,846 |
| Events in quadrant C | 2,082,726 | 1,315,040 |
| Events in quadrant D | 3,255,650 | 1,268,645 |
| Mode M9 | |||
|---|---|---|---|
| Quadrant | BADHDUFLAG | Total packets | Discarded packets |
| A | 0 | 19 | 0 |
| B | 0 | 19 | 0 |
| C | 0 | 19 | 0 |
| D | 0 | 19 | 0 |
| Mode M0 | |||
|---|---|---|---|
| Quadrant | BADHDUFLAG | Total packets | Discarded packets |
| A | 0 | 49017 | 0 |
| B | 0 | 21733 | 0 |
| C | 0 | 21168 | 0 |
| D | 0 | 25275 | 0 |
| Mode SS | |||
|---|---|---|---|
| Quadrant | BADHDUFLAG | Total packets | Discarded packets |
| A | 0 | 206 | 0 |
| B | 0 | 206 | 0 |
| C | 0 | 206 | 0 |
| D | 0 | 206 | 0 |
| Quadrant | Total seconds | Saturated seconds | Saturation percentage |
|---|---|---|---|
| A | 10099 | 3995 | 39.558372% |
| B | 10099 | 85 | 0.841667% |
| C | 10099 | 140 | 1.386276% |
| D | 10099 | 415 | 4.109318% |
Noise dominated data is calculated using 1-second bins in cleaned event files. If a bin has >2000 counts, and if more than 50% of those come from <1% of pixels, then it is considered to be noise-dominated and hence unusable.
| Quadrant | # 1 sec bins | Bins with >0 counts | Bins with >2000 counts | High rate bins dominated by noise | Noise dominated (total time) | Noise dominated (detector-on time) | Marked lightcurve |
|---|---|---|---|---|---|---|---|
| A | 12038 | 10095 | 2 | 2 | 0.02% | 0.02% |  |
| B | 12039 | 10097 | 3 | 3 | 0.02% | 0.03% |  |
| C | 12039 | 10097 | 0 | 0 | 0.00% | 0.00% | 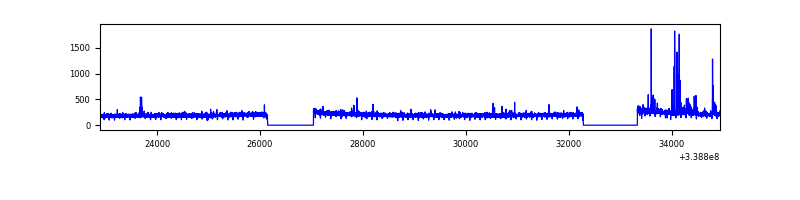 |
| D | 12039 | 10097 | 27 | 27 | 0.22% | 0.27% |  |
Top three noisy pixels from each quadrant. If the there are fewer than three noisy pixels in the level2.evt file, extra rows are filled as -1
| Pixel properties | Quadrant properties | ||||||
|---|---|---|---|---|---|---|---|
| Quadrant | DetID | PixID | Counts | Sigma | Mean | Median | Sigma |
| A | 14 | 235 | 4310996 | 45160.61 | 428 | 420 | 95.4 |
| A | 6 | 16 | 31078 | 321.19 | 428 | 420 | 95.4 |
| A | 0 | 13 | 17150 | 175.28 | 428 | 420 | 95.4 |
| B | 0 | 189 | 136325 | 1286.64 | 541 | 529 | 105.5 |
| B | 3 | 64 | 136034 | 1283.88 | 541 | 529 | 105.5 |
| B | 0 | 219 | 17746 | 163.13 | 541 | 529 | 105.5 |
| C | 15 | 208 | 57301 | 444.58 | 524 | 520 | 127.7 |
| C | 4 | 224 | 4674 | 32.52 | 524 | 520 | 127.7 |
| C | 10 | 22 | 3059 | 19.88 | 524 | 520 | 127.7 |
| D | 2 | 250 | 604496 | 4895.02 | 525 | 507 | 123.4 |
| D | 1 | 52 | 308705 | 2497.79 | 525 | 507 | 123.4 |
| D | 12 | 233 | 165701 | 1338.81 | 525 | 507 | 123.4 |
Histogram calculated using DETX and DETY for each event in the final _common_clean file
| Quadrant A |  |
 |
Quadrant B |
|---|---|---|---|
| Quadrant D |  |
 |
Quadrant C |
| Plot type | Count rate plots | Images |
|---|---|---|
| Comparison with Poisson distribution Blue bars denote a histogram of data divided into 1 sec bins. Red curve is a Poisson curve with rate = median count rate of data. |
 |
 |
| Quadrant-wise count rates Data is divided into 100 sec bins |
 |
|
| Module-wise count rates for Quadrant A Data is divided into 100 sec bins |
 |
 |
| Module-wise count rates for Quadrant B Data is divided into 100 sec bins |
 |
 |
| Module-wise count rates for Quadrant C Data is divided into 100 sec bins |
 |
 |
| Module-wise count rates for Quadrant D Data is divided into 100 sec bins |
 |
 |
| Parameter | Plot |
|---|---|
| CZT HV Monitor |  |
| D_VDD |  |
| Temperature 1 |  |
| Veto HV Monitor |  |
| Veto LLD |  |
| Alpha Counter |  |
| _CPM_Rate | 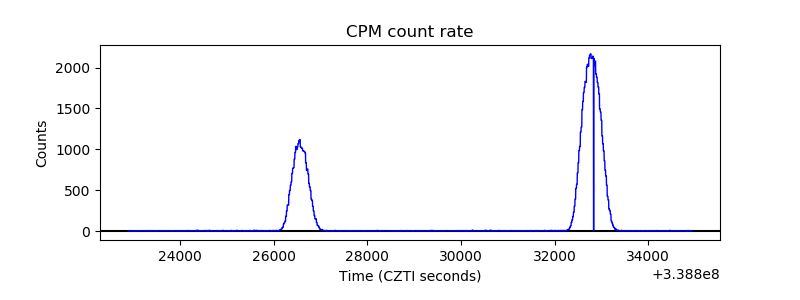 |
| CZT Counter | 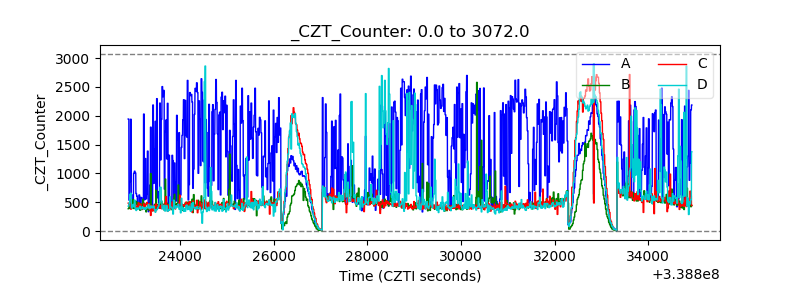 |
| +2.5 Volts monitor |  |
| +5 Volts monitor |  |
| _ROLL_ROT |  |
| _Roll_DEC |  |
| _Roll_RA |  |
| Veto Counter | 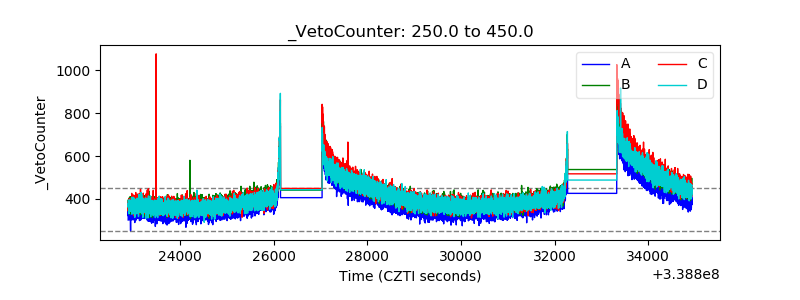 |