| Param | Original file | Final file |
|---|---|---|
| Filename | modeM0/AS1A09_120T02_9000003904cztM0_level2_bc.evt | modeM0/AS1A09_120T02_9000003904cztM0_level2_quad_clean.evt |
| Size (bytes) | 14,314,654,080 | 3,836,240,640 |
| Size | 13.3 GB | 3.6 GB |
| Events in quadrant A | 124,168,035 | 23,048,930 |
| Events in quadrant B | 121,190,330 | 25,711,259 |
| Events in quadrant C | 58,714,767 | 25,408,137 |
| Events in quadrant D | 111,587,539 | 24,026,094 |
| Mode M9 | |||
|---|---|---|---|
| Quadrant | BADHDUFLAG | Total packets | Discarded packets |
| A | 0 | 421 | 0 |
| B | 0 | 422 | 0 |
| C | 0 | 422 | 0 |
| D | 0 | 422 | 0 |
| Mode SS | |||
|---|---|---|---|
| Quadrant | BADHDUFLAG | Total packets | Discarded packets |
| A | 0 | 5352 | 0 |
| B | 0 | 5352 | 0 |
| C | 0 | 5352 | 0 |
| D | 0 | 5352 | 0 |
| Mode M0 | |||
|---|---|---|---|
| Quadrant | BADHDUFLAG | Total packets | Discarded packets |
| A | 0 | 931640 | 0 |
| B | 0 | 751936 | 0 |
| C | 0 | 562126 | 0 |
| D | 0 | 743745 | 0 |
| Quadrant | Total seconds | Saturated seconds | Saturation percentage |
|---|---|---|---|
| A | 262633 | 47194 | 17.969562% |
| B | 262645 | 29171 | 11.106627% |
| C | 262637 | 4834 | 1.840563% |
| D | 262650 | 18175 | 6.919855% |
Noise dominated data is calculated using 1-second bins in cleaned event files. If a bin has >2000 counts, and if more than 50% of those come from <1% of pixels, then it is considered to be noise-dominated and hence unusable.
| Quadrant | # 1 sec bins | Bins with >0 counts | Bins with >2000 counts | High rate bins dominated by noise | Noise dominated (total time) | Noise dominated (detector-on time) | Marked lightcurve |
|---|---|---|---|---|---|---|---|
| A | 309172 | 262636 | 105 | 105 | 0.03% | 0.04% |  |
| B | 309172 | 262630 | 10449 | 10449 | 3.38% | 3.98% |  |
| C | 309172 | 262634 | 11 | 11 | 0.00% | 0.00% |  |
| D | 309172 | 262632 | 4496 | 4496 | 1.45% | 1.71% |  |
Top three noisy pixels from each quadrant. If the there are fewer than three noisy pixels in the level2.evt file, extra rows are filled as -1
| Pixel properties | Quadrant properties | ||||||
|---|---|---|---|---|---|---|---|
| Quadrant | DetID | PixID | Counts | Sigma | Mean | Median | Sigma |
| A | 14 | 235 | 67772952 | 22010.09 | 14014 | 13796 | 3078.5 |
| A | 6 | 16 | 1371496 | 441.02 | 14014 | 13796 | 3078.5 |
| A | 0 | 13 | 559904 | 177.39 | 14014 | 13796 | 3078.5 |
| B | 0 | 189 | 60780699 | 20986.8 | 14944 | 14706 | 2895.4 |
| B | 10 | 246 | 1367191 | 467.11 | 14944 | 14706 | 2895.4 |
| B | 0 | 219 | 611604 | 206.15 | 14944 | 14706 | 2895.4 |
| C | 15 | 208 | 944650 | 262.71 | 14917 | 14971 | 3538.8 |
| C | 2 | 16 | 267931 | 71.48 | 14917 | 14971 | 3538.8 |
| C | 4 | 224 | 90011 | 21.2 | 14917 | 14971 | 3538.8 |
| D | 1 | 52 | 42676219 | 12397.71 | 14665 | 14222 | 3441.1 |
| D | 2 | 250 | 4772146 | 1382.67 | 14665 | 14222 | 3441.1 |
| D | 12 | 233 | 4196182 | 1215.29 | 14665 | 14222 | 3441.1 |
Histogram calculated using DETX and DETY for each event in the final _common_clean file
| Quadrant A |  |
 |
Quadrant B |
|---|---|---|---|
| Quadrant D |  |
 |
Quadrant C |
| Plot type | Count rate plots | Images |
|---|---|---|
| Comparison with Poisson distribution Blue bars denote a histogram of data divided into 1 sec bins. Red curve is a Poisson curve with rate = median count rate of data. |
 |
 |
| Quadrant-wise count rates Data is divided into 100 sec bins |
 |
|
| Module-wise count rates for Quadrant A Data is divided into 100 sec bins |
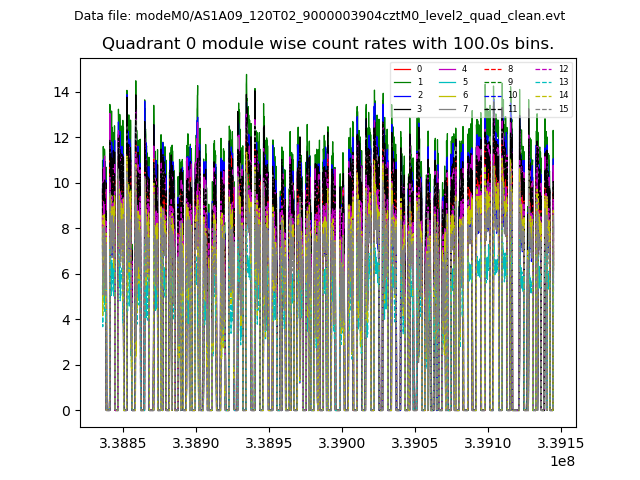 |
 |
| Module-wise count rates for Quadrant B Data is divided into 100 sec bins |
 |
 |
| Module-wise count rates for Quadrant C Data is divided into 100 sec bins |
 |
 |
| Module-wise count rates for Quadrant D Data is divided into 100 sec bins |
 |
 |
| Parameter | Plot |
|---|---|
| CZT HV Monitor |  |
| D_VDD |  |
| Temperature 1 |  |
| Veto HV Monitor |  |
| Veto LLD |  |
| Alpha Counter |  |
| _CPM_Rate | 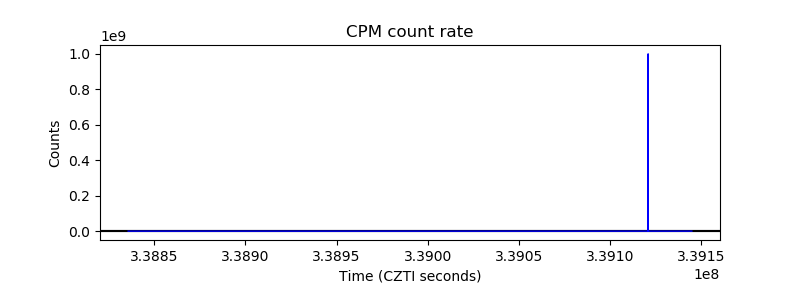 |
| CZT Counter |  |
| +2.5 Volts monitor |  |
| +5 Volts monitor |  |
| _ROLL_ROT |  |
| _Roll_DEC |  |
| _Roll_RA |  |
| Veto Counter |  |