| Param | Original file | Final file |
|---|---|---|
| Filename | modeM0/AS1A09_145T01_9000003900cztM0_level2_bc.evt | modeM0/AS1A09_145T01_9000003900cztM0_level2_quad_clean.evt |
| Size (bytes) | 11,564,343,360 | 3,183,373,440 |
| Size | 10.8 GB | 3.0 GB |
| Events in quadrant A | 132,546,409 | 18,406,556 |
| Events in quadrant B | 54,459,556 | 21,884,881 |
| Events in quadrant C | 49,139,044 | 20,964,603 |
| Events in quadrant D | 98,972,366 | 19,941,065 |
| Mode SS | |||
|---|---|---|---|
| Quadrant | BADHDUFLAG | Total packets | Discarded packets |
| A | 0 | 4526 | 0 |
| B | 0 | 4526 | 0 |
| C | 0 | 4526 | 0 |
| D | 0 | 4526 | 0 |
| Mode M0 | |||
|---|---|---|---|
| Quadrant | BADHDUFLAG | Total packets | Discarded packets |
| A | 0 | 902417 | 0 |
| B | 0 | 484362 | 0 |
| C | 0 | 471772 | 0 |
| D | 0 | 642741 | 0 |
| Mode M9 | |||
|---|---|---|---|
| Quadrant | BADHDUFLAG | Total packets | Discarded packets |
| A | 0 | 354 | 0 |
| B | 0 | 355 | 0 |
| C | 0 | 355 | 0 |
| D | 0 | 355 | 0 |
| Quadrant | Total seconds | Saturated seconds | Saturation percentage |
|---|---|---|---|
| A | 222095 | 54788 | 24.668723% |
| B | 222095 | 4124 | 1.856863% |
| C | 222095 | 3916 | 1.763209% |
| D | 222094 | 15233 | 6.858808% |
Noise dominated data is calculated using 1-second bins in cleaned event files. If a bin has >2000 counts, and if more than 50% of those come from <1% of pixels, then it is considered to be noise-dominated and hence unusable.
| Quadrant | # 1 sec bins | Bins with >0 counts | Bins with >2000 counts | High rate bins dominated by noise | Noise dominated (total time) | Noise dominated (detector-on time) | Marked lightcurve |
|---|---|---|---|---|---|---|---|
| A | 261998 | 222067 | 5210 | 5210 | 1.99% | 2.35% |  |
| B | 261998 | 222062 | 135 | 135 | 0.05% | 0.06% |  |
| C | 261998 | 222069 | 26 | 26 | 0.01% | 0.01% | 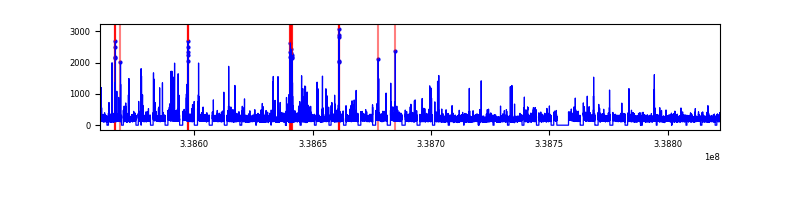 |
| D | 261998 | 222062 | 3302 | 3302 | 1.26% | 1.49% |  |
Top three noisy pixels from each quadrant. If the there are fewer than three noisy pixels in the level2.evt file, extra rows are filled as -1
| Pixel properties | Quadrant properties | ||||||
|---|---|---|---|---|---|---|---|
| Quadrant | DetID | PixID | Counts | Sigma | Mean | Median | Sigma |
| A | 14 | 235 | 52813130 | 21236.23 | 11304 | 11108 | 2486.4 |
| A | 6 | 16 | 34594617 | 13909.0 | 11304 | 11108 | 2486.4 |
| A | 12 | 16 | 748630 | 296.62 | 11304 | 11108 | 2486.4 |
| B | 0 | 189 | 2305949 | 923.42 | 12965 | 12743 | 2483.4 |
| B | 10 | 245 | 722121 | 285.65 | 12965 | 12743 | 2483.4 |
| B | 5 | 172 | 593763 | 233.96 | 12965 | 12743 | 2483.4 |
| C | 15 | 208 | 646144 | 215.85 | 12441 | 12505 | 2935.6 |
| C | 2 | 16 | 291012 | 94.87 | 12441 | 12505 | 2935.6 |
| C | 3 | 233 | 135957 | 42.05 | 12441 | 12505 | 2935.6 |
| D | 1 | 52 | 29824024 | 10008.48 | 12209 | 11858 | 2978.7 |
| D | 5 | 222 | 6909406 | 2315.63 | 12209 | 11858 | 2978.7 |
| D | 11 | 176 | 5467124 | 1831.43 | 12209 | 11858 | 2978.7 |
Histogram calculated using DETX and DETY for each event in the final _common_clean file
| Quadrant A | 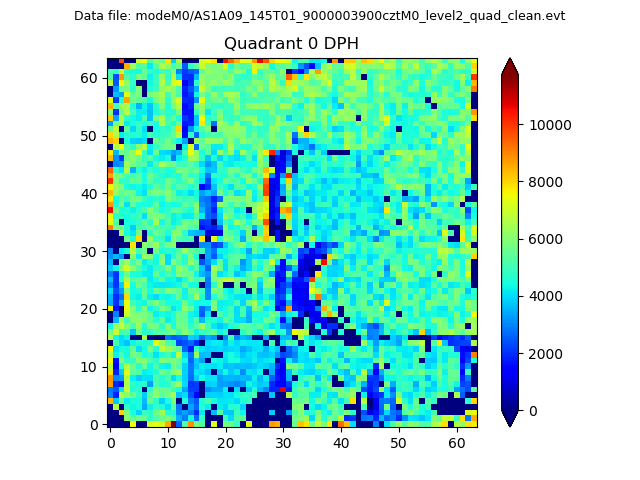 |
 |
Quadrant B |
|---|---|---|---|
| Quadrant D |  |
 |
Quadrant C |
| Plot type | Count rate plots | Images |
|---|---|---|
| Comparison with Poisson distribution Blue bars denote a histogram of data divided into 1 sec bins. Red curve is a Poisson curve with rate = median count rate of data. |
 |
 |
| Quadrant-wise count rates Data is divided into 100 sec bins |
 |
|
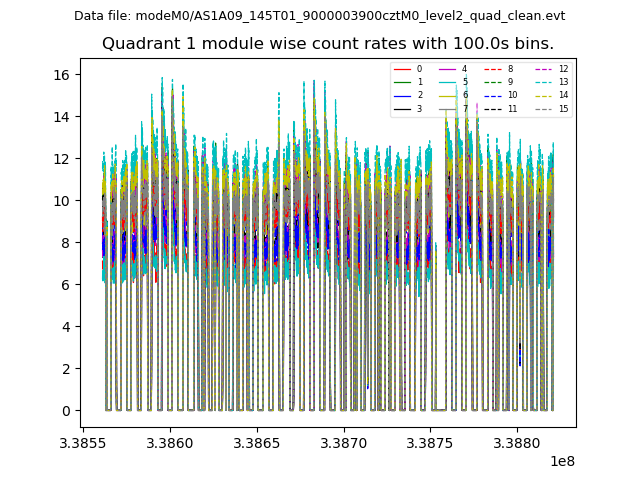
| Module-wise count rates for Quadrant A Data is divided into 100 sec bins |
 |
 |
| Module-wise count rates for Quadrant B Data is divided into 100 sec bins |
 |
 |
| Module-wise count rates for Quadrant C Data is divided into 100 sec bins |
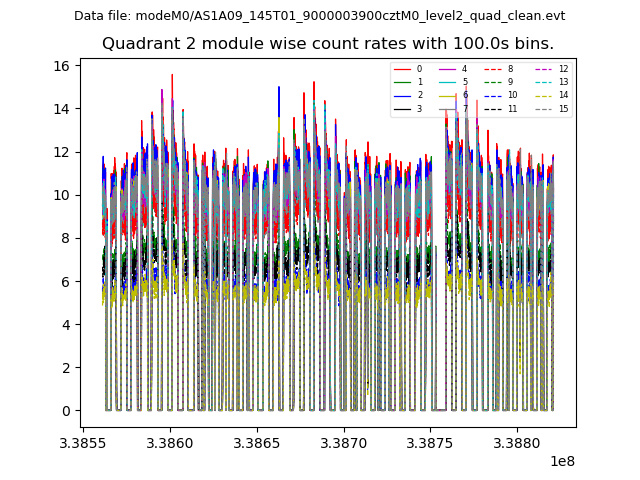 |
 |
| Module-wise count rates for Quadrant D Data is divided into 100 sec bins |
 |
 |
| Parameter | Plot |
|---|---|
| CZT HV Monitor |  |
| D_VDD |  |
| Temperature 1 |  |
| Veto HV Monitor |  |
| Veto LLD |  |
| Alpha Counter |  |
| _CPM_Rate |  |
| CZT Counter |  |
| +2.5 Volts monitor |  |
| +5 Volts monitor |  |
| _ROLL_ROT |  |
| _Roll_DEC | 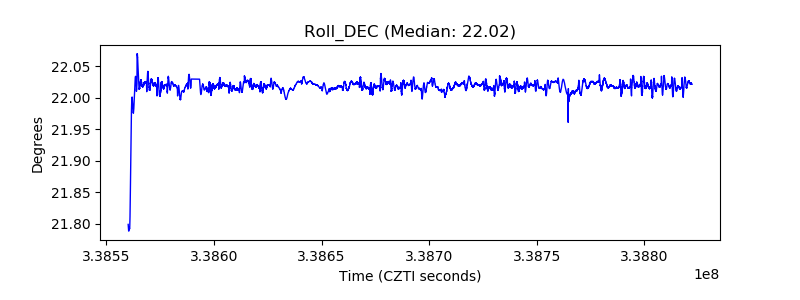 |
| _Roll_RA | 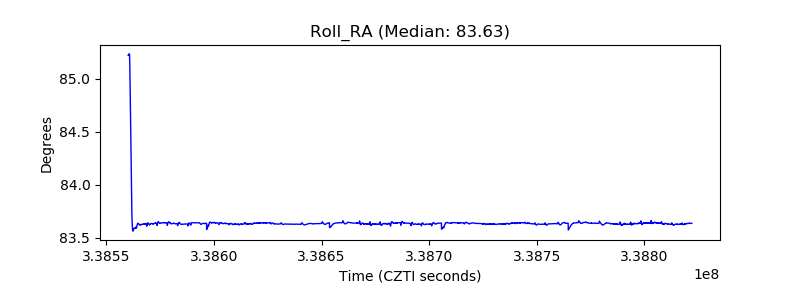 |
| Veto Counter | 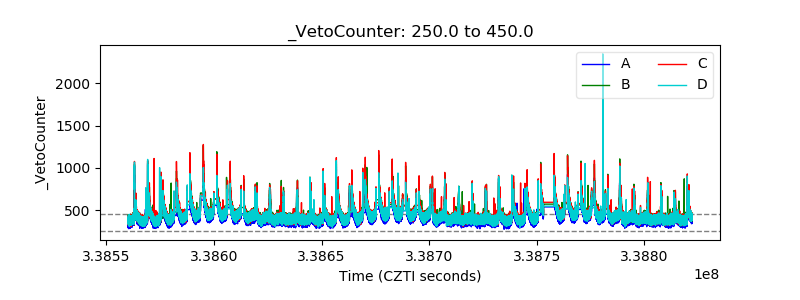 |