| Param | Original file | Final file |
|---|---|---|
| Filename | modeM0/AS1C05_019T03_9000003898cztM0_level2_bc.evt | modeM0/AS1C05_019T03_9000003898cztM0_level2_quad_clean.evt |
| Size (bytes) | 5,492,462,400 | 1,555,315,200 |
| Size | 5.1 GB | 1.4 GB |
| Events in quadrant A | 50,035,419 | 8,482,193 |
| Events in quadrant B | 58,684,578 | 10,816,980 |
| Events in quadrant C | 18,277,208 | 11,172,412 |
| Events in quadrant D | 33,440,690 | 10,682,349 |
| Mode M0 | |||
|---|---|---|---|
| Quadrant | BADHDUFLAG | Total packets | Discarded packets |
| A | 0 | 408214 | 0 |
| B | 0 | 305445 | 0 |
| C | 0 | 181627 | 0 |
| D | 0 | 233987 | 0 |
| Mode M9 | |||
|---|---|---|---|
| Quadrant | BADHDUFLAG | Total packets | Discarded packets |
| A | 0 | 123 | 0 |
| B | 0 | 123 | 0 |
| C | 0 | 123 | 0 |
| D | 0 | 123 | 0 |
| Mode SS | |||
|---|---|---|---|
| Quadrant | BADHDUFLAG | Total packets | Discarded packets |
| A | 0 | 1770 | 0 |
| B | 0 | 1770 | 0 |
| C | 0 | 1770 | 0 |
| D | 0 | 1770 | 0 |
| Quadrant | Total seconds | Saturated seconds | Saturation percentage |
|---|---|---|---|
| A | 86573 | 36312 | 41.943793% |
| B | 86573 | 16228 | 18.744874% |
| C | 86573 | 1449 | 1.673732% |
| D | 86573 | 4305 | 4.972682% |
Noise dominated data is calculated using 1-second bins in cleaned event files. If a bin has >2000 counts, and if more than 50% of those come from <1% of pixels, then it is considered to be noise-dominated and hence unusable.
| Quadrant | # 1 sec bins | Bins with >0 counts | Bins with >2000 counts | High rate bins dominated by noise | Noise dominated (total time) | Noise dominated (detector-on time) | Marked lightcurve |
|---|---|---|---|---|---|---|---|
| A | 99083 | 86557 | 395 | 395 | 0.40% | 0.46% |  |
| B | 99083 | 86560 | 5228 | 5228 | 5.28% | 6.04% |  |
| C | 99083 | 86569 | 33 | 33 | 0.03% | 0.04% | 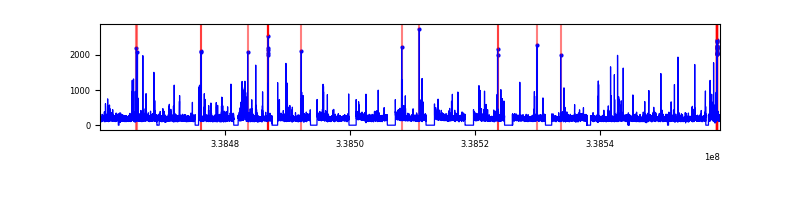 |
| D | 99083 | 86565 | 462 | 462 | 0.47% | 0.53% | 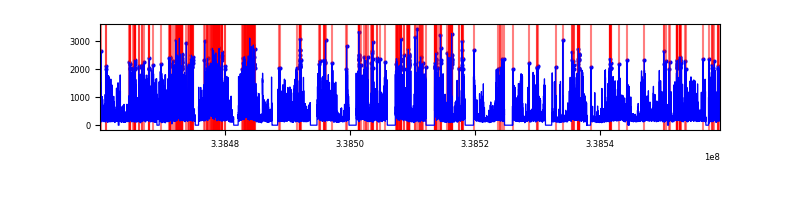 |
Top three noisy pixels from each quadrant. If the there are fewer than three noisy pixels in the level2.evt file, extra rows are filled as -1
| Pixel properties | Quadrant properties | ||||||
|---|---|---|---|---|---|---|---|
| Quadrant | DetID | PixID | Counts | Sigma | Mean | Median | Sigma |
| A | 14 | 235 | 32004845 | 42333.69 | 3469 | 3407 | 755.9 |
| A | 6 | 16 | 3830323 | 5062.51 | 3469 | 3407 | 755.9 |
| A | 0 | 13 | 519443 | 682.65 | 3469 | 3407 | 755.9 |
| B | 0 | 189 | 39987522 | 47248.95 | 4395 | 4294 | 846.2 |
| B | 5 | 172 | 1089573 | 1282.5 | 4395 | 4294 | 846.2 |
| B | 0 | 219 | 199535 | 230.72 | 4395 | 4294 | 846.2 |
| C | 2 | 16 | 521807 | 490.78 | 4452 | 4453 | 1054.1 |
| C | 15 | 208 | 375154 | 351.66 | 4452 | 4453 | 1054.1 |
| C | 0 | 207 | 126222 | 115.51 | 4452 | 4453 | 1054.1 |
| D | 1 | 52 | 8072750 | 7754.53 | 4456 | 4316 | 1040.5 |
| D | 2 | 250 | 4640670 | 4455.97 | 4456 | 4316 | 1040.5 |
| D | 11 | 176 | 1298329 | 1243.67 | 4456 | 4316 | 1040.5 |
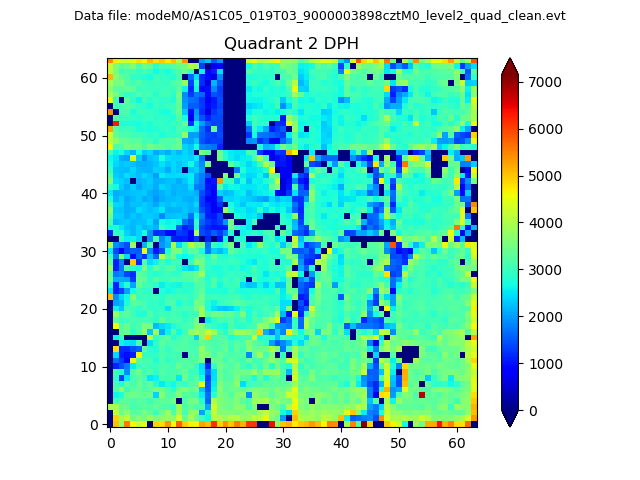
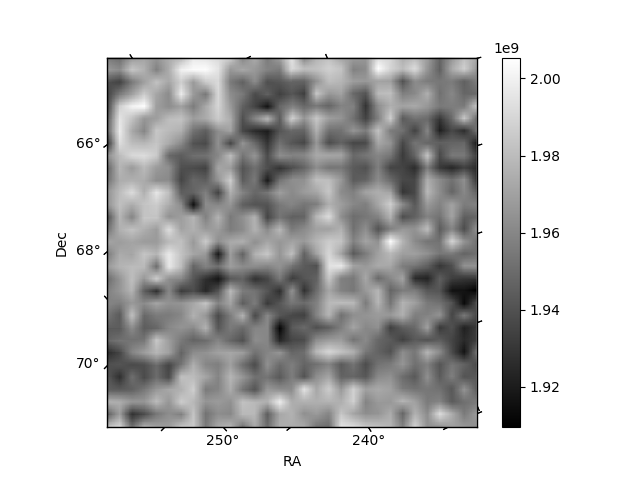
Histogram calculated using DETX and DETY for each event in the final _common_clean file
| Quadrant A |  |
 |
Quadrant B |
|---|---|---|---|
| Quadrant D | 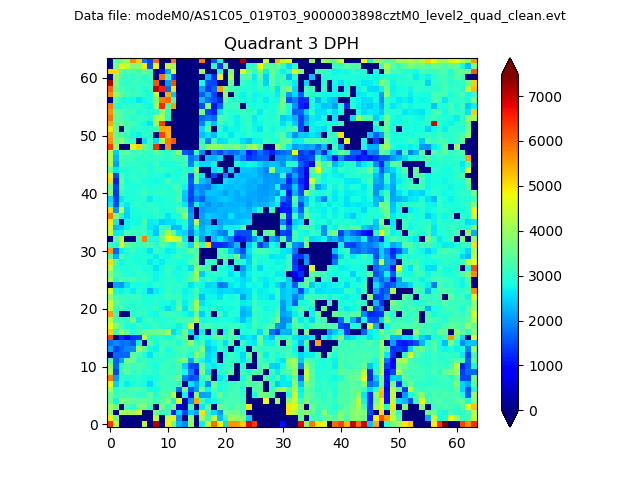 |
 |
Quadrant C |
| Plot type | Count rate plots | Images |
|---|---|---|
| Comparison with Poisson distribution Blue bars denote a histogram of data divided into 1 sec bins. Red curve is a Poisson curve with rate = median count rate of data. |
 |
 |
| Quadrant-wise count rates Data is divided into 100 sec bins |
 |
|
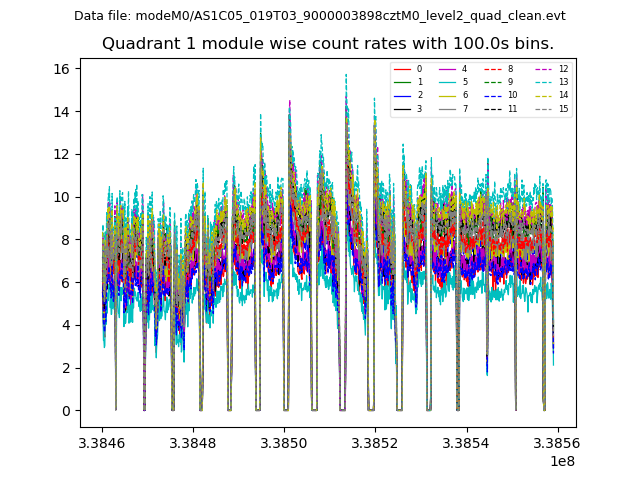
| Module-wise count rates for Quadrant A Data is divided into 100 sec bins |
 |
 |
| Module-wise count rates for Quadrant B Data is divided into 100 sec bins |
 |
 |
| Module-wise count rates for Quadrant C Data is divided into 100 sec bins |
 |
 |
| Module-wise count rates for Quadrant D Data is divided into 100 sec bins |
 |
 |
| Parameter | Plot |
|---|---|
| CZT HV Monitor |  |
| D_VDD |  |
| Temperature 1 |  |
| Veto HV Monitor |  |
| Veto LLD |  |
| Alpha Counter |  |
| _CPM_Rate |  |
| CZT Counter |  |
| +2.5 Volts monitor |  |
| +5 Volts monitor |  |
| _ROLL_ROT |  |
| _Roll_DEC |  |
| _Roll_RA |  |
| Veto Counter |  |