| Param | Original file | Final file |
|---|---|---|
| Filename | modeM0/AS1T03_233T01_9000003894cztM0_level2_bc.evt | modeM0/AS1T03_233T01_9000003894cztM0_level2_quad_clean.evt |
| Size (bytes) | 807,370,560 | 182,350,080 |
| Size | 770.0 MB | 173.9 MB |
| Events in quadrant A | 2,695,094 | 1,394,141 |
| Events in quadrant B | 12,133,545 | 712,501 |
| Events in quadrant C | 2,181,321 | 1,386,342 |
| Events in quadrant D | 6,676,215 | 1,257,321 |
| Mode SS | |||
|---|---|---|---|
| Quadrant | BADHDUFLAG | Total packets | Discarded packets |
| A | 0 | 224 | 0 |
| B | 0 | 224 | 0 |
| C | 0 | 224 | 0 |
| D | 0 | 224 | 0 |
| Mode M0 | |||
|---|---|---|---|
| Quadrant | BADHDUFLAG | Total packets | Discarded packets |
| A | 0 | 23800 | 1 |
| B | 0 | 67742 | 1 |
| C | 0 | 22745 | 1 |
| D | 0 | 37842 | 1 |
| Mode M9 | |||
|---|---|---|---|
| Quadrant | BADHDUFLAG | Total packets | Discarded packets |
| A | 0 | 4 | 0 |
| B | 0 | 4 | 0 |
| C | 0 | 4 | 0 |
| D | 0 | 4 | 0 |
| Quadrant | Total seconds | Saturated seconds | Saturation percentage |
|---|---|---|---|
| A | 11097 | 106 | 0.955213% |
| B | 11097 | 8488 | 76.489141% |
| C | 11097 | 154 | 1.387762% |
| D | 11097 | 1527 | 13.760476% |
Noise dominated data is calculated using 1-second bins in cleaned event files. If a bin has >2000 counts, and if more than 50% of those come from <1% of pixels, then it is considered to be noise-dominated and hence unusable.
| Quadrant | # 1 sec bins | Bins with >0 counts | Bins with >2000 counts | High rate bins dominated by noise | Noise dominated (total time) | Noise dominated (detector-on time) | Marked lightcurve |
|---|---|---|---|---|---|---|---|
| A | 11531 | 11095 | 0 | 0 | 0.00% | 0.00% |  |
| B | 11531 | 10874 | 1935 | 1935 | 16.78% | 17.79% | 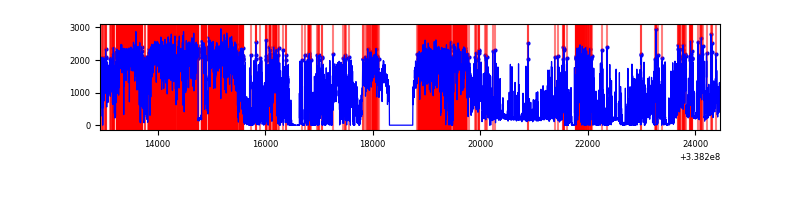 |
| C | 11532 | 11096 | 2 | 2 | 0.02% | 0.02% |  |
| D | 11531 | 11095 | 759 | 759 | 6.58% | 6.84% |  |
Top three noisy pixels from each quadrant. If the there are fewer than three noisy pixels in the level2.evt file, extra rows are filled as -1
| Pixel properties | Quadrant properties | ||||||
|---|---|---|---|---|---|---|---|
| Quadrant | DetID | PixID | Counts | Sigma | Mean | Median | Sigma |
| A | 0 | 13 | 429915 | 3460.99 | 560 | 550 | 124.1 |
| A | 5 | 168 | 88319 | 707.48 | 560 | 550 | 124.1 |
| A | 13 | 254 | 17271 | 134.78 | 560 | 550 | 124.1 |
| B | 0 | 189 | 7676309 | 124590.0 | 302 | 294 | 61.6 |
| B | 3 | 64 | 3127073 | 50750.99 | 302 | 294 | 61.6 |
| B | 10 | 246 | 57737 | 932.35 | 302 | 294 | 61.6 |
| C | 2 | 16 | 24066 | 177.97 | 551 | 548 | 132.1 |
| C | 15 | 208 | 20383 | 150.1 | 551 | 548 | 132.1 |
| C | 8 | 128 | 9646 | 68.85 | 551 | 548 | 132.1 |
| D | 7 | 80 | 3361043 | 27384.0 | 525 | 506 | 122.7 |
| D | 1 | 52 | 926539 | 7545.96 | 525 | 506 | 122.7 |
| D | 2 | 250 | 174615 | 1418.76 | 525 | 506 | 122.7 |
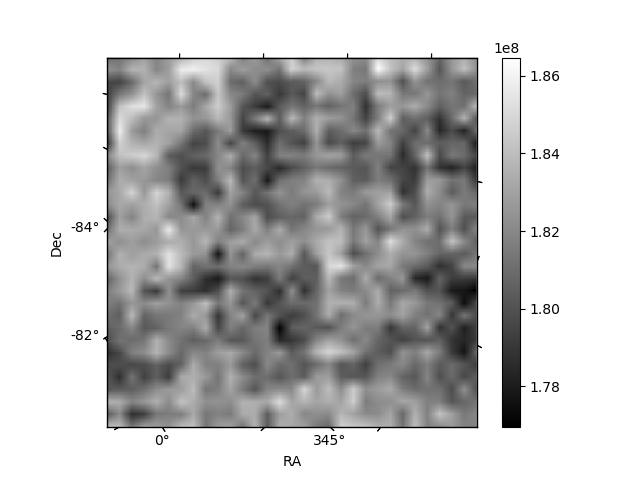
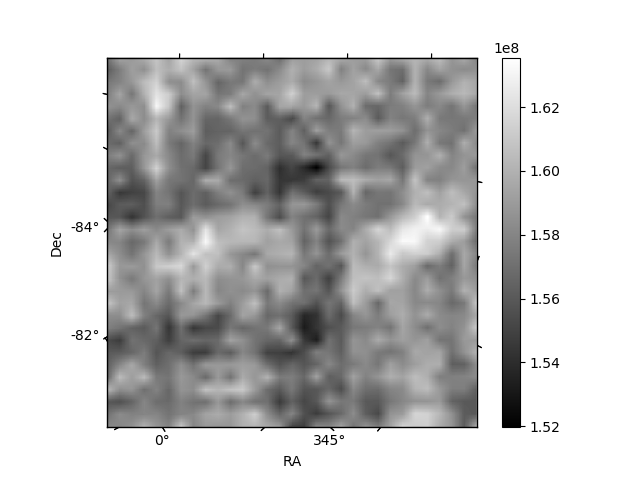
Histogram calculated using DETX and DETY for each event in the final _common_clean file
| Quadrant A | 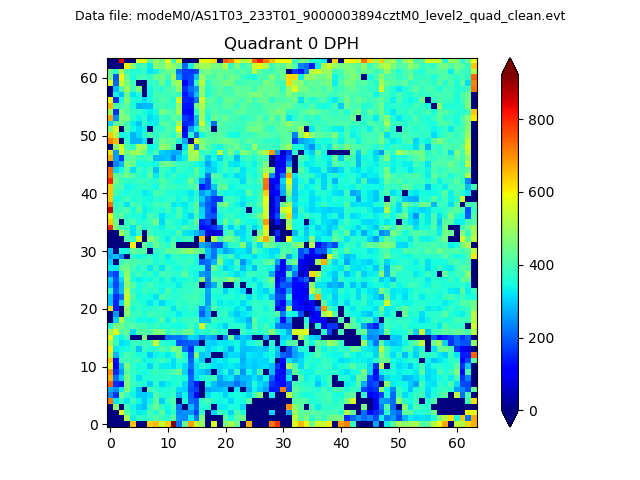 |
 |
Quadrant B |
|---|---|---|---|
| Quadrant D | 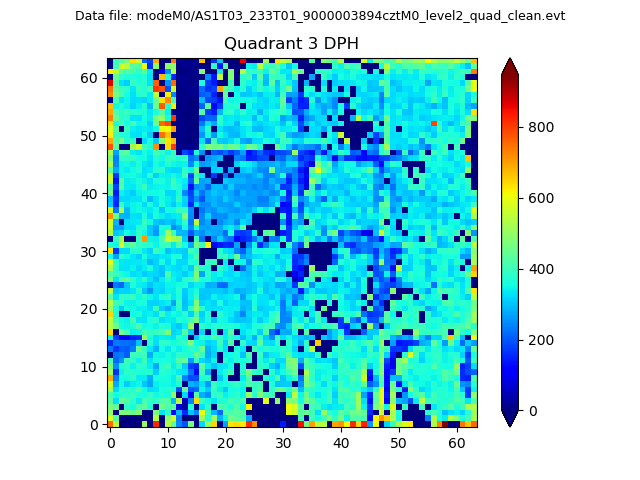 |
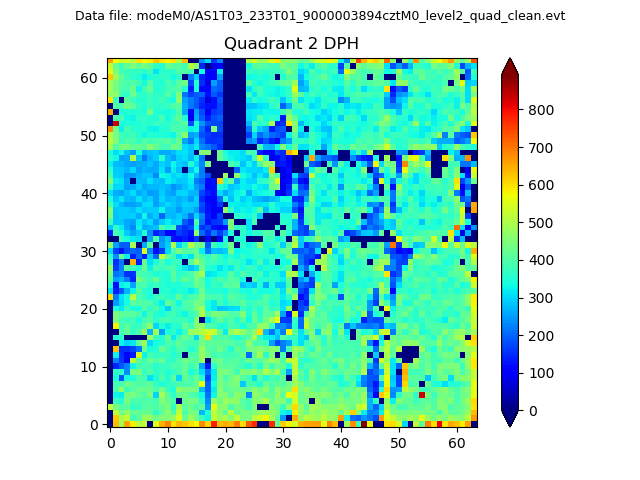 |
Quadrant C |
| Plot type | Count rate plots | Images |
|---|---|---|
| Comparison with Poisson distribution Blue bars denote a histogram of data divided into 1 sec bins. Red curve is a Poisson curve with rate = median count rate of data. |
 |
 |
| Quadrant-wise count rates Data is divided into 100 sec bins |
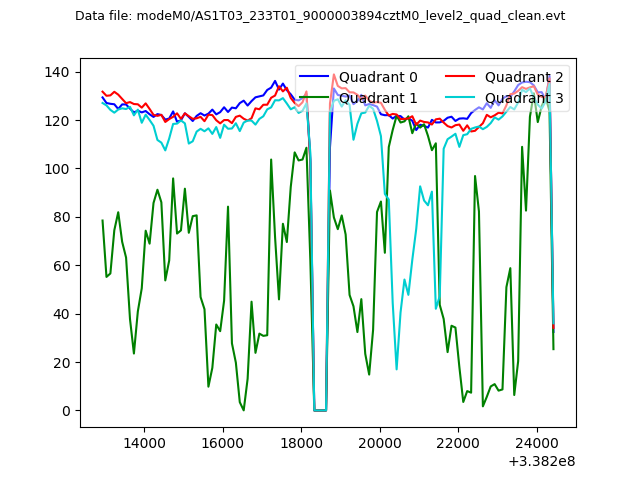 |
|
| Module-wise count rates for Quadrant A Data is divided into 100 sec bins |
 |
 |
| Module-wise count rates for Quadrant B Data is divided into 100 sec bins |
 |
 |
| Module-wise count rates for Quadrant C Data is divided into 100 sec bins |
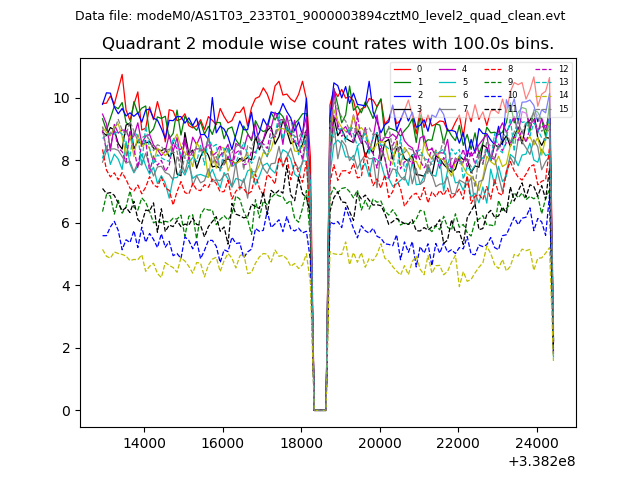 |
 |
| Module-wise count rates for Quadrant D Data is divided into 100 sec bins |
 |
 |
| Parameter | Plot |
|---|---|
| CZT HV Monitor |  |
| D_VDD |  |
| Temperature 1 |  |
| Veto HV Monitor | 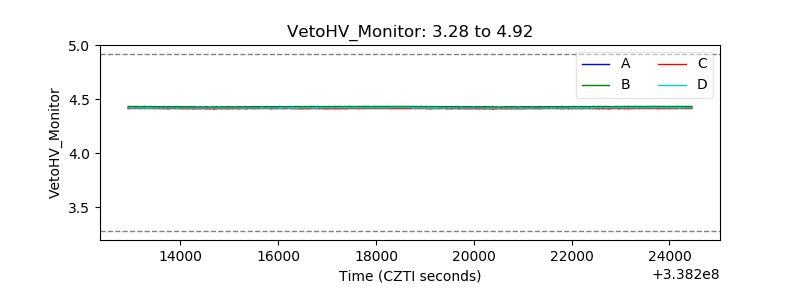 |
| Veto LLD |  |
| Alpha Counter |  |
| _CPM_Rate |  |
| CZT Counter | 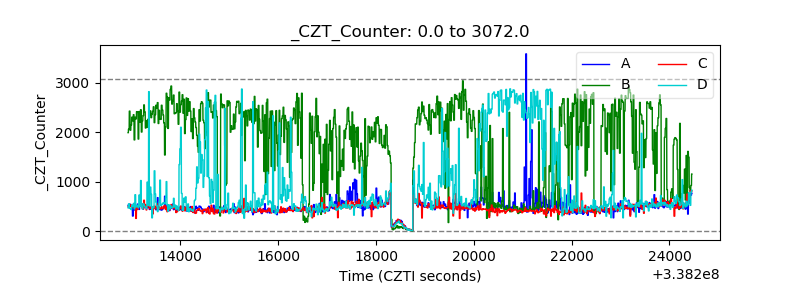 |
| +2.5 Volts monitor |  |
| +5 Volts monitor |  |
| _ROLL_ROT | 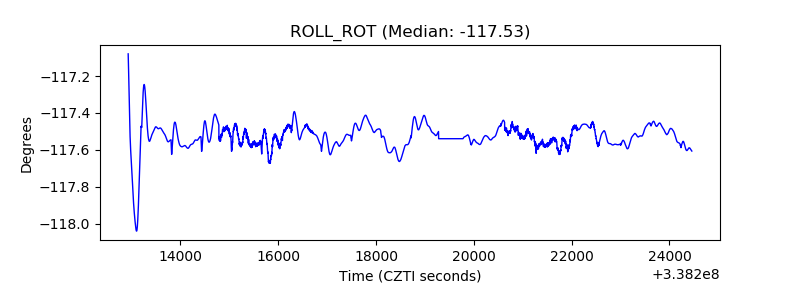 |
| _Roll_DEC |  |
| _Roll_RA |  |
| Veto Counter |  |