| Param | Original file | Final file |
|---|---|---|
| Filename | modeM0/AS1A09_134T01_9000003896cztM0_level2_bc.evt | modeM0/AS1A09_134T01_9000003896cztM0_level2_quad_clean.evt |
| Size (bytes) | 688,498,560 | 96,099,840 |
| Size | 656.6 MB | 91.6 MB |
| Events in quadrant A | 2,878,662 | 646,032 |
| Events in quadrant B | 12,442,953 | 471,858 |
| Events in quadrant C | 1,642,696 | 648,362 |
| Events in quadrant D | 3,352,495 | 602,538 |
| Mode SS | |||
|---|---|---|---|
| Quadrant | BADHDUFLAG | Total packets | Discarded packets |
| A | 0 | 156 | 0 |
| B | 0 | 156 | 0 |
| C | 0 | 156 | 0 |
| D | 0 | 156 | 0 |
| Mode M9 | |||
|---|---|---|---|
| Quadrant | BADHDUFLAG | Total packets | Discarded packets |
| A | 0 | 4 | 0 |
| B | 0 | 4 | 0 |
| C | 0 | 4 | 0 |
| D | 0 | 4 | 0 |
| Mode M0 | |||
|---|---|---|---|
| Quadrant | BADHDUFLAG | Total packets | Discarded packets |
| A | 0 | 20220 | 0 |
| B | 0 | 49255 | 0 |
| C | 0 | 16185 | 0 |
| D | 0 | 21959 | 0 |
| Quadrant | Total seconds | Saturated seconds | Saturation percentage |
|---|---|---|---|
| A | 7764 | 504 | 6.491499% |
| B | 7765 | 5259 | 67.726980% |
| C | 7765 | 205 | 2.640052% |
| D | 7765 | 491 | 6.323245% |
Noise dominated data is calculated using 1-second bins in cleaned event files. If a bin has >2000 counts, and if more than 50% of those come from <1% of pixels, then it is considered to be noise-dominated and hence unusable.
| Quadrant | # 1 sec bins | Bins with >0 counts | Bins with >2000 counts | High rate bins dominated by noise | Noise dominated (total time) | Noise dominated (detector-on time) | Marked lightcurve |
|---|---|---|---|---|---|---|---|
| A | 8099 | 7763 | 181 | 181 | 2.23% | 2.33% |  |
| B | 8100 | 7764 | 2356 | 2356 | 29.09% | 30.35% |  |
| C | 8100 | 7764 | 0 | 0 | 0.00% | 0.00% |  |
| D | 8100 | 7764 | 100 | 100 | 1.23% | 1.29% |  |
Top three noisy pixels from each quadrant. If the there are fewer than three noisy pixels in the level2.evt file, extra rows are filled as -1
| Pixel properties | Quadrant properties | ||||||
|---|---|---|---|---|---|---|---|
| Quadrant | DetID | PixID | Counts | Sigma | Mean | Median | Sigma |
| A | 6 | 16 | 973457 | 10760.22 | 403 | 394 | 90.4 |
| A | 14 | 235 | 312151 | 3447.44 | 403 | 394 | 90.4 |
| A | 0 | 13 | 26030 | 283.49 | 403 | 394 | 90.4 |
| B | 0 | 189 | 11119172 | 167159.87 | 332 | 324 | 66.5 |
| B | 0 | 219 | 18357 | 271.11 | 332 | 324 | 66.5 |
| B | 0 | 244 | 7526 | 108.27 | 332 | 324 | 66.5 |
| C | 0 | 207 | 55801 | 569.47 | 402 | 401 | 97.3 |
| C | 2 | 16 | 19047 | 191.67 | 402 | 401 | 97.3 |
| C | 15 | 208 | 11755 | 116.71 | 402 | 401 | 97.3 |
| D | 1 | 52 | 1444099 | 15672.48 | 395 | 381 | 92.1 |
| D | 2 | 250 | 215113 | 2331.05 | 395 | 381 | 92.1 |
| D | 12 | 1 | 67133 | 724.64 | 395 | 381 | 92.1 |
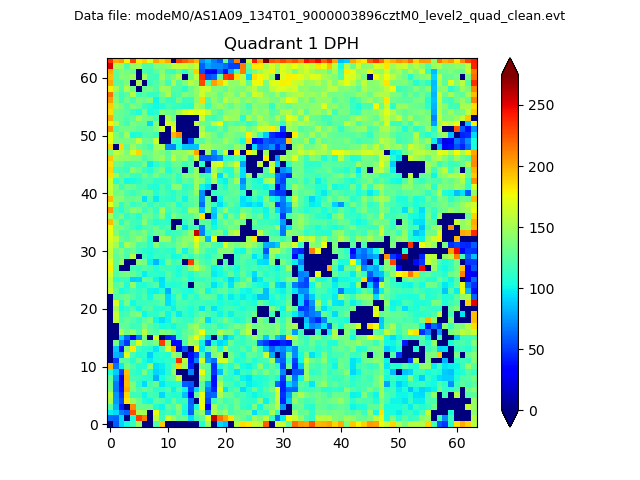
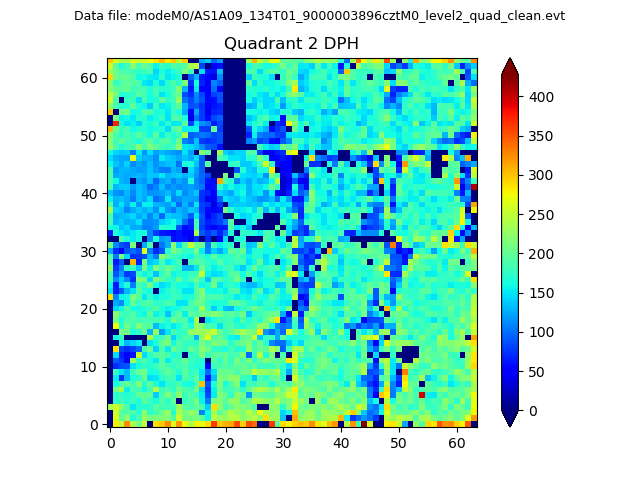
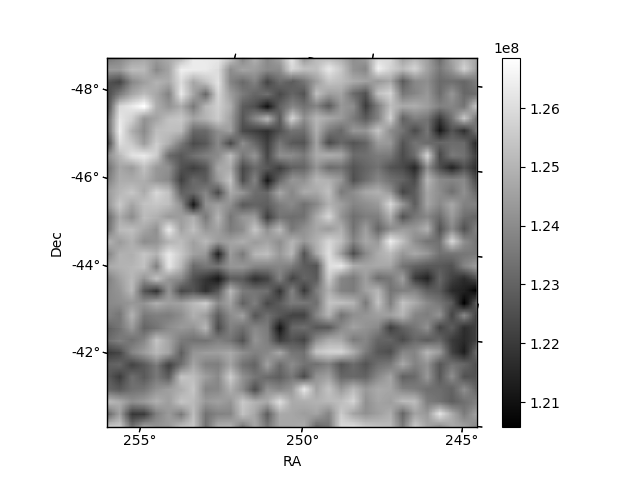
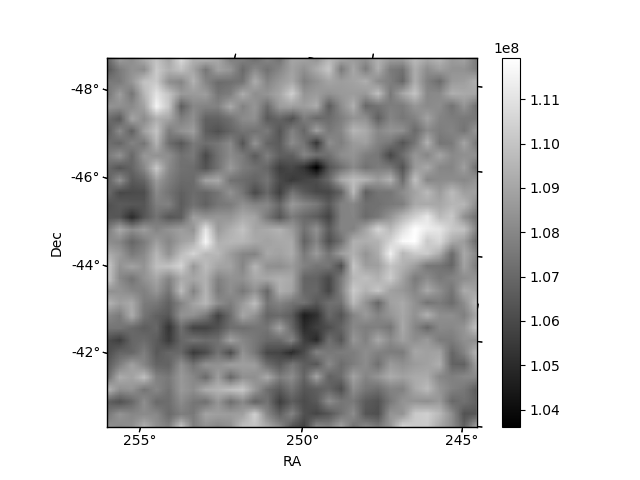
Histogram calculated using DETX and DETY for each event in the final _common_clean file
| Quadrant A |  |
 |
Quadrant B |
|---|---|---|---|
| Quadrant D |  |
 |
Quadrant C |
| Plot type | Count rate plots | Images |
|---|---|---|
| Comparison with Poisson distribution Blue bars denote a histogram of data divided into 1 sec bins. Red curve is a Poisson curve with rate = median count rate of data. |
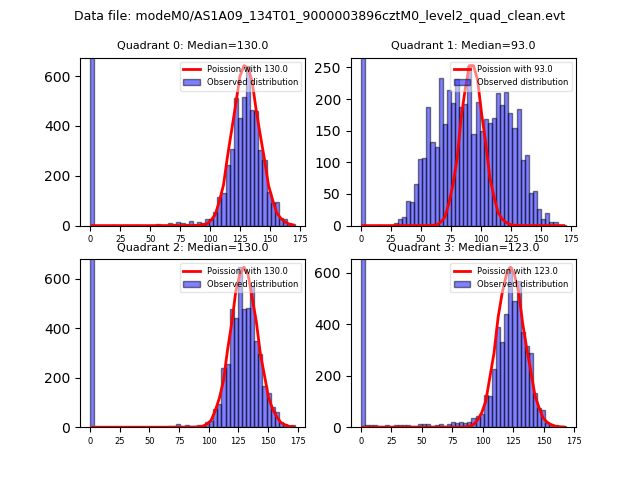 |
 |
| Quadrant-wise count rates Data is divided into 100 sec bins |
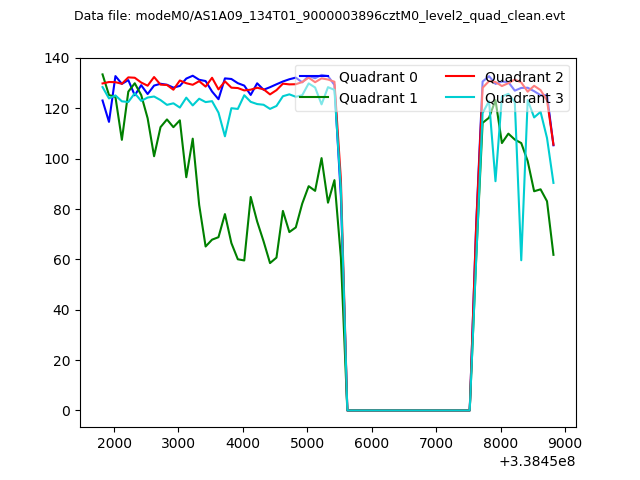 |
|
| Module-wise count rates for Quadrant A Data is divided into 100 sec bins |
 |
 |
| Module-wise count rates for Quadrant B Data is divided into 100 sec bins |
 |
 |
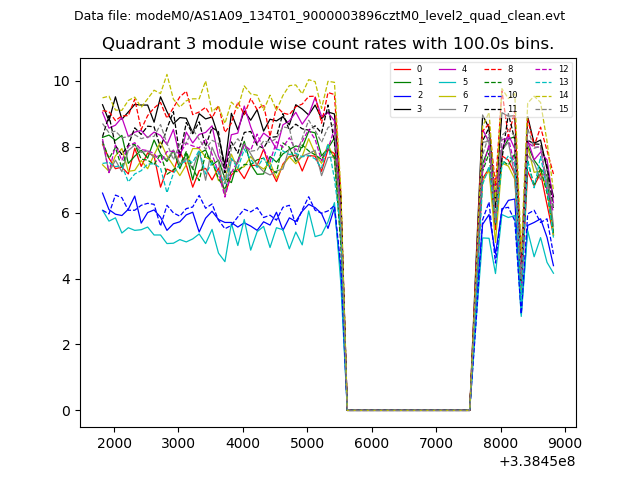
| Module-wise count rates for Quadrant C Data is divided into 100 sec bins |
 |
 |
| Module-wise count rates for Quadrant D Data is divided into 100 sec bins |
 |
 |
| Parameter | Plot |
|---|---|
| CZT HV Monitor |  |
| D_VDD |  |
| Temperature 1 |  |
| Veto HV Monitor |  |
| Veto LLD |  |
| Alpha Counter |  |
| _CPM_Rate |  |
| CZT Counter |  |
| +2.5 Volts monitor |  |
| +5 Volts monitor |  |
| _ROLL_ROT |  |
| _Roll_DEC | 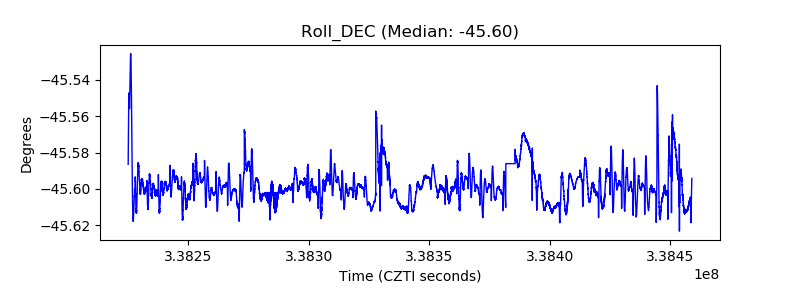 |
| _Roll_RA |  |
| Veto Counter |  |