| Param | Original file | Final file |
|---|---|---|
| Filename | modeM0/AS1A09_038T19_9000003892cztM0_level2_bc.evt | modeM0/AS1A09_038T19_9000003892cztM0_level2_quad_clean.evt |
| Size (bytes) | 869,195,520 | 223,142,400 |
| Size | 828.9 MB | 212.8 MB |
| Events in quadrant A | 2,722,661 | 1,574,752 |
| Events in quadrant B | 13,057,390 | 1,344,124 |
| Events in quadrant C | 2,618,159 | 1,570,464 |
| Events in quadrant D | 7,021,894 | 1,356,582 |
| Mode SS | |||
|---|---|---|---|
| Quadrant | BADHDUFLAG | Total packets | Discarded packets |
| A | 0 | 270 | 0 |
| B | 0 | 270 | 0 |
| C | 0 | 270 | 0 |
| D | 0 | 270 | 0 |
| Mode M9 | |||
|---|---|---|---|
| Quadrant | BADHDUFLAG | Total packets | Discarded packets |
| A | 0 | 8 | 0 |
| B | 0 | 8 | 0 |
| C | 0 | 8 | 0 |
| D | 0 | 8 | 0 |
| Mode M0 | |||
|---|---|---|---|
| Quadrant | BADHDUFLAG | Total packets | Discarded packets |
| A | 0 | 27425 | 0 |
| B | 0 | 60357 | 0 |
| C | 0 | 27449 | 0 |
| D | 0 | 48101 | 0 |
| Quadrant | Total seconds | Saturated seconds | Saturation percentage |
|---|---|---|---|
| A | 13148 | 492 | 3.742014% |
| B | 13148 | 5500 | 41.831457% |
| C | 13148 | 567 | 4.312443% |
| D | 13148 | 2759 | 20.984180% |
Noise dominated data is calculated using 1-second bins in cleaned event files. If a bin has >2000 counts, and if more than 50% of those come from <1% of pixels, then it is considered to be noise-dominated and hence unusable.
| Quadrant | # 1 sec bins | Bins with >0 counts | Bins with >2000 counts | High rate bins dominated by noise | Noise dominated (total time) | Noise dominated (detector-on time) | Marked lightcurve |
|---|---|---|---|---|---|---|---|
| A | 14068 | 13146 | 0 | 0 | 0.00% | 0.00% |  |
| B | 14068 | 13129 | 2072 | 2072 | 14.73% | 15.78% |  |
| C | 14068 | 13146 | 0 | 0 | 0.00% | 0.00% |  |
| D | 14068 | 13145 | 362 | 362 | 2.57% | 2.75% | 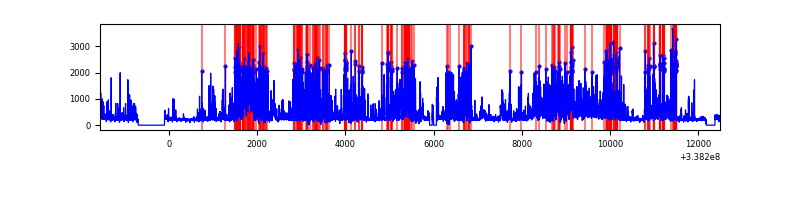 |
Top three noisy pixels from each quadrant. If the there are fewer than three noisy pixels in the level2.evt file, extra rows are filled as -1
| Pixel properties | Quadrant properties | ||||||
|---|---|---|---|---|---|---|---|
| Quadrant | DetID | PixID | Counts | Sigma | Mean | Median | Sigma |
| A | 5 | 168 | 52806 | 348.0 | 678 | 664 | 149.8 |
| A | 8 | 192 | 33772 | 220.97 | 678 | 664 | 149.8 |
| A | 13 | 254 | 19684 | 126.94 | 678 | 664 | 149.8 |
| B | 0 | 189 | 10392435 | 90109.55 | 589 | 574 | 115.3 |
| B | 10 | 246 | 132865 | 1147.11 | 589 | 574 | 115.3 |
| B | 10 | 245 | 104661 | 902.55 | 589 | 574 | 115.3 |
| C | 15 | 208 | 28088 | 170.97 | 672 | 669 | 160.4 |
| C | 2 | 16 | 4069 | 21.2 | 672 | 669 | 160.4 |
| C | 13 | 61 | 3916 | 20.25 | 672 | 669 | 160.4 |
| D | 1 | 52 | 3072793 | 22058.36 | 609 | 589 | 139.3 |
| D | 7 | 80 | 1133405 | 8133.59 | 609 | 589 | 139.3 |
| D | 2 | 250 | 272264 | 1950.62 | 609 | 589 | 139.3 |
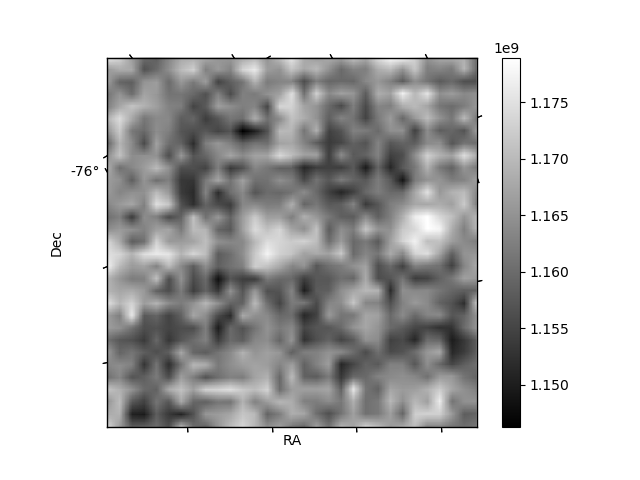
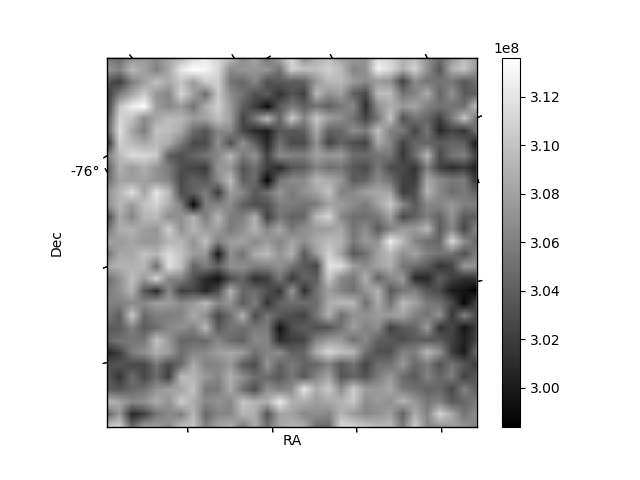
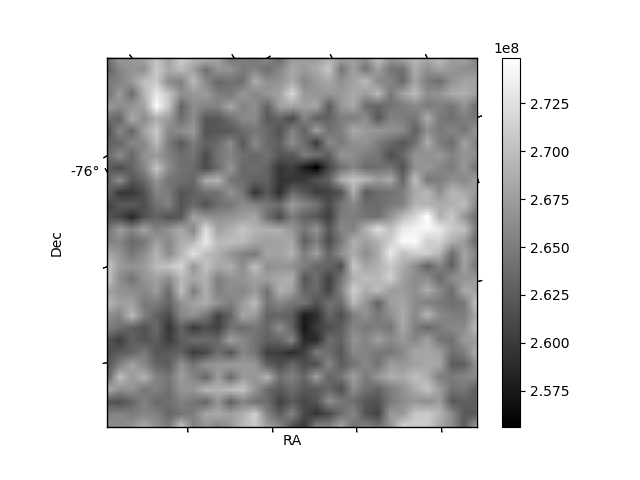
Histogram calculated using DETX and DETY for each event in the final _common_clean file
| Quadrant A |  |
 |
Quadrant B |
|---|---|---|---|
| Quadrant D |  |
 |
Quadrant C |
| Plot type | Count rate plots | Images |
|---|---|---|
| Comparison with Poisson distribution Blue bars denote a histogram of data divided into 1 sec bins. Red curve is a Poisson curve with rate = median count rate of data. |
 |
 |
| Quadrant-wise count rates Data is divided into 100 sec bins |
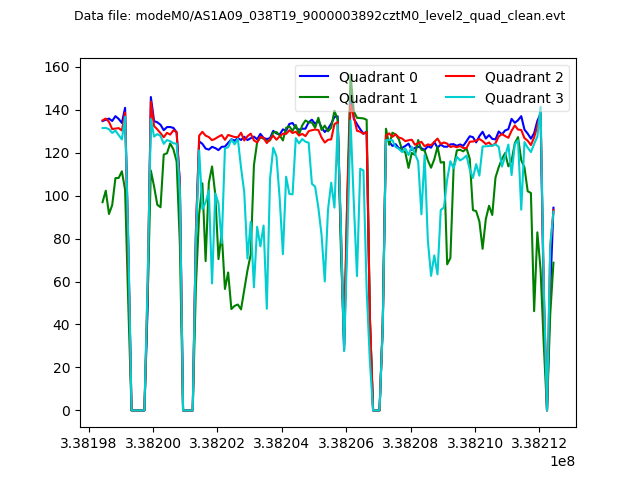 |
|
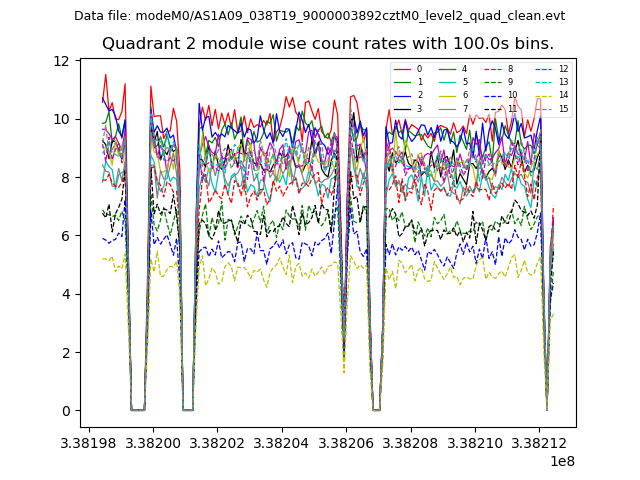
| Module-wise count rates for Quadrant A Data is divided into 100 sec bins |
 |
 |
| Module-wise count rates for Quadrant B Data is divided into 100 sec bins |
 |
 |
| Module-wise count rates for Quadrant C Data is divided into 100 sec bins |
 |
 |
| Module-wise count rates for Quadrant D Data is divided into 100 sec bins |
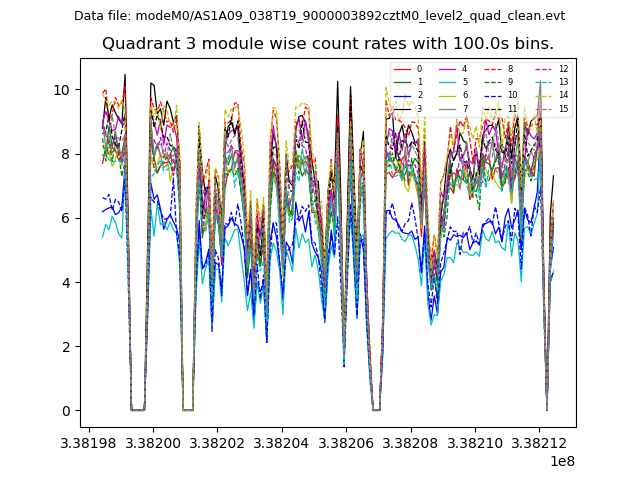 |
 |
| Parameter | Plot |
|---|---|
| CZT HV Monitor |  |
| D_VDD |  |
| Temperature 1 |  |
| Veto HV Monitor |  |
| Veto LLD | 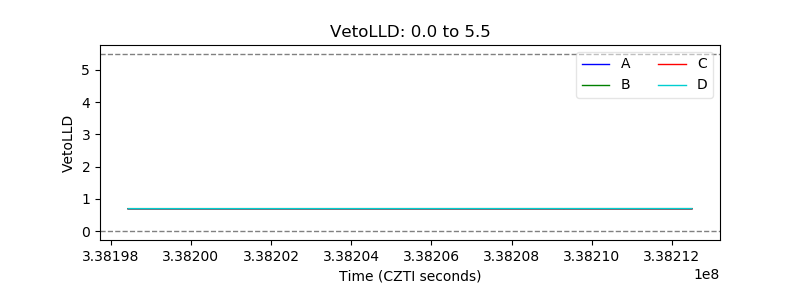 |
| Alpha Counter | 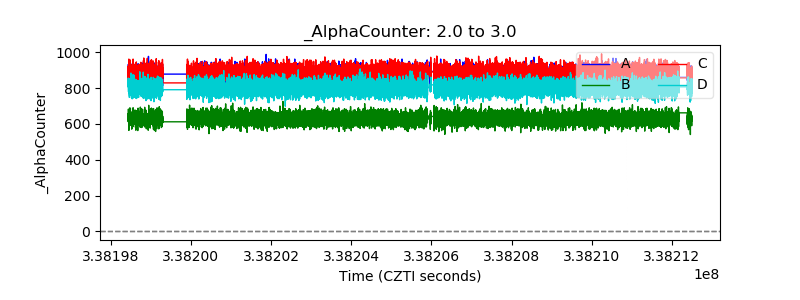 |
| _CPM_Rate |  |
| CZT Counter |  |
| +2.5 Volts monitor | 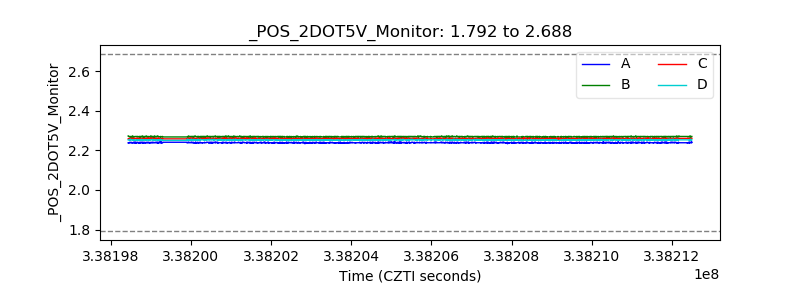 |
| +5 Volts monitor |  |
| _ROLL_ROT | 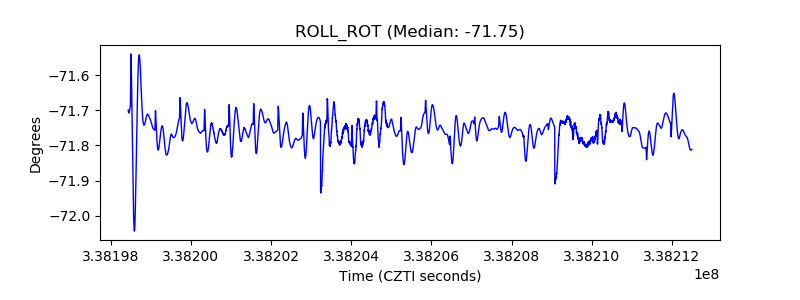 |
| _Roll_DEC |  |
| _Roll_RA | 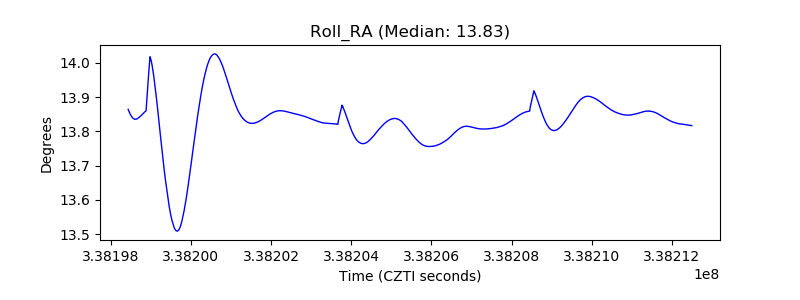 |
| Veto Counter |  |