| Param | Original file | Final file |
|---|---|---|
| Filename | modeM0/AS1A09_038T18_9000003890cztM0_level2_bc.evt | modeM0/AS1A09_038T18_9000003890cztM0_level2_quad_clean.evt |
| Size (bytes) | 429,960,960 | 110,923,200 |
| Size | 410.0 MB | 105.8 MB |
| Events in quadrant A | 1,967,615 | 770,637 |
| Events in quadrant B | 6,549,776 | 617,763 |
| Events in quadrant C | 1,293,533 | 790,661 |
| Events in quadrant D | 2,784,030 | 749,081 |
| Mode SS | |||
|---|---|---|---|
| Quadrant | BADHDUFLAG | Total packets | Discarded packets |
| A | 0 | 124 | 0 |
| B | 0 | 124 | 0 |
| C | 0 | 124 | 0 |
| D | 0 | 124 | 0 |
| Mode M0 | |||
|---|---|---|---|
| Quadrant | BADHDUFLAG | Total packets | Discarded packets |
| A | 0 | 14942 | 0 |
| B | 0 | 29357 | 0 |
| C | 0 | 12576 | 0 |
| D | 0 | 18164 | 0 |
| Mode M9 | |||
|---|---|---|---|
| Quadrant | BADHDUFLAG | Total packets | Discarded packets |
| A | 0 | 11 | 0 |
| B | 0 | 11 | 0 |
| C | 0 | 11 | 0 |
| D | 0 | 11 | 0 |
| Quadrant | Total seconds | Saturated seconds | Saturation percentage |
|---|---|---|---|
| A | 6163 | 232 | 3.764400% |
| B | 6163 | 2702 | 43.842285% |
| C | 6163 | 53 | 0.859971% |
| D | 6163 | 312 | 5.062470% |
Noise dominated data is calculated using 1-second bins in cleaned event files. If a bin has >2000 counts, and if more than 50% of those come from <1% of pixels, then it is considered to be noise-dominated and hence unusable.
| Quadrant | # 1 sec bins | Bins with >0 counts | Bins with >2000 counts | High rate bins dominated by noise | Noise dominated (total time) | Noise dominated (detector-on time) | Marked lightcurve |
|---|---|---|---|---|---|---|---|
| A | 7203 | 6163 | 45 | 45 | 0.62% | 0.73% |  |
| B | 7203 | 6163 | 1807 | 1807 | 25.09% | 29.32% |  |
| C | 7203 | 6163 | 0 | 0 | 0.00% | 0.00% |  |
| D | 7203 | 6163 | 32 | 32 | 0.44% | 0.52% | 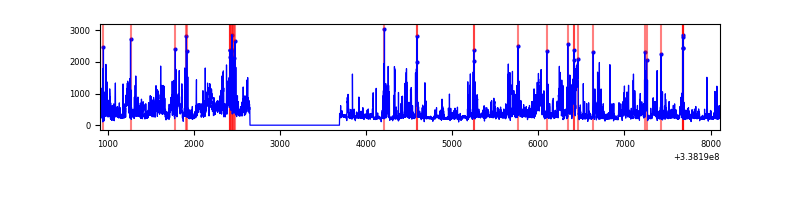 |
Top three noisy pixels from each quadrant. If the there are fewer than three noisy pixels in the level2.evt file, extra rows are filled as -1
| Pixel properties | Quadrant properties | ||||||
|---|---|---|---|---|---|---|---|
| Quadrant | DetID | PixID | Counts | Sigma | Mean | Median | Sigma |
| A | 0 | 13 | 681884 | 9198.49 | 330 | 324 | 74.1 |
| A | 13 | 254 | 9202 | 119.82 | 330 | 324 | 74.1 |
| A | 8 | 192 | 8943 | 116.32 | 330 | 324 | 74.1 |
| B | 0 | 189 | 5351362 | 98543.48 | 273 | 268 | 54.3 |
| B | 10 | 245 | 111563 | 2049.56 | 273 | 268 | 54.3 |
| B | 3 | 64 | 12842 | 231.56 | 273 | 268 | 54.3 |
| C | 15 | 208 | 11660 | 141.58 | 332 | 332 | 80.0 |
| C | 2 | 16 | 4153 | 47.76 | 332 | 332 | 80.0 |
| C | 13 | 61 | 1875 | 19.28 | 332 | 332 | 80.0 |
| D | 1 | 52 | 1001181 | 11552.69 | 327 | 318 | 86.6 |
| D | 7 | 80 | 337733 | 3894.69 | 327 | 318 | 86.6 |
| D | 2 | 250 | 96427 | 1109.36 | 327 | 318 | 86.6 |
Histogram calculated using DETX and DETY for each event in the final _common_clean file
| Quadrant A |  |
 |
Quadrant B |
|---|---|---|---|
| Quadrant D |  |
 |
Quadrant C |
| Plot type | Count rate plots | Images |
|---|---|---|
| Comparison with Poisson distribution Blue bars denote a histogram of data divided into 1 sec bins. Red curve is a Poisson curve with rate = median count rate of data. |
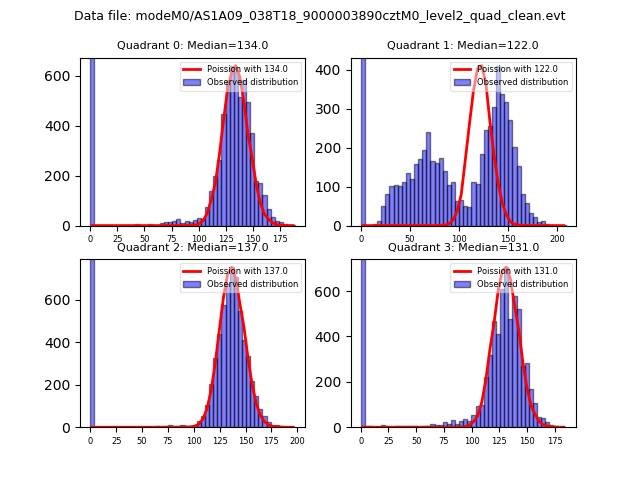 |
 |
| Quadrant-wise count rates Data is divided into 100 sec bins |
 |
|
| Module-wise count rates for Quadrant A Data is divided into 100 sec bins |
 |
 |
| Module-wise count rates for Quadrant B Data is divided into 100 sec bins |
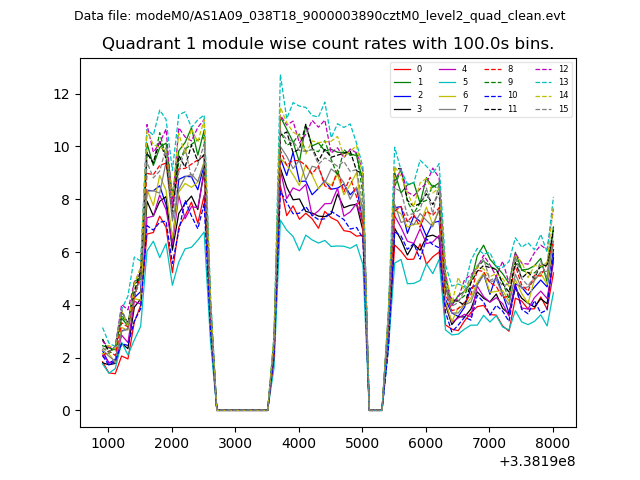 |
 |
| Module-wise count rates for Quadrant C Data is divided into 100 sec bins |
 |
 |
| Module-wise count rates for Quadrant D Data is divided into 100 sec bins |
 |
 |
| Parameter | Plot |
|---|---|
| CZT HV Monitor |  |
| D_VDD |  |
| Temperature 1 |  |
| Veto HV Monitor |  |
| Veto LLD |  |
| Alpha Counter |  |
| _CPM_Rate |  |
| CZT Counter |  |
| +2.5 Volts monitor |  |
| +5 Volts monitor |  |
| _ROLL_ROT |  |
| _Roll_DEC |  |
| _Roll_RA |  |
| Veto Counter |  |