| Param | Original file | Final file |
|---|---|---|
| Filename | modeM0/AS1T03_232T01_9000003886cztM0_level2_bc.evt | modeM0/AS1T03_232T01_9000003886cztM0_level2_quad_clean.evt |
| Size (bytes) | 466,436,160 | 183,332,160 |
| Size | 444.8 MB | 174.8 MB |
| Events in quadrant A | 3,883,887 | 1,220,475 |
| Events in quadrant B | 2,467,054 | 1,259,531 |
| Events in quadrant C | 1,952,412 | 1,228,109 |
| Events in quadrant D | 5,145,786 | 1,162,112 |
| Mode SS | |||
|---|---|---|---|
| Quadrant | BADHDUFLAG | Total packets | Discarded packets |
| A | 0 | 200 | 0 |
| B | 0 | 200 | 0 |
| C | 0 | 200 | 0 |
| D | 0 | 200 | 0 |
| Mode M9 | |||
|---|---|---|---|
| Quadrant | BADHDUFLAG | Total packets | Discarded packets |
| A | 0 | 3 | 0 |
| B | 0 | 3 | 0 |
| C | 0 | 3 | 0 |
| D | 0 | 3 | 0 |
| Mode M0 | |||
|---|---|---|---|
| Quadrant | BADHDUFLAG | Total packets | Discarded packets |
| A | 0 | 26339 | 0 |
| B | 0 | 22039 | 0 |
| C | 0 | 20271 | 0 |
| D | 0 | 31257 | 0 |
| Quadrant | Total seconds | Saturated seconds | Saturation percentage |
|---|---|---|---|
| A | 9842 | 338 | 3.434261% |
| B | 9842 | 221 | 2.245479% |
| C | 9842 | 174 | 1.767933% |
| D | 9842 | 746 | 7.579760% |
Noise dominated data is calculated using 1-second bins in cleaned event files. If a bin has >2000 counts, and if more than 50% of those come from <1% of pixels, then it is considered to be noise-dominated and hence unusable.
| Quadrant | # 1 sec bins | Bins with >0 counts | Bins with >2000 counts | High rate bins dominated by noise | Noise dominated (total time) | Noise dominated (detector-on time) | Marked lightcurve |
|---|---|---|---|---|---|---|---|
| A | 10152 | 9842 | 34 | 34 | 0.33% | 0.35% |  |
| B | 10152 | 9840 | 4 | 4 | 0.04% | 0.04% | 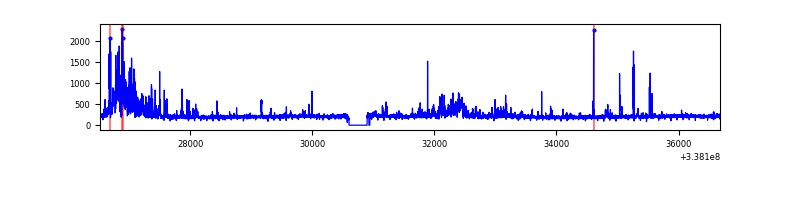 |
| C | 10152 | 9843 | 0 | 0 | 0.00% | 0.00% |  |
| D | 10152 | 9841 | 164 | 164 | 1.62% | 1.67% |  |
Top three noisy pixels from each quadrant. If the there are fewer than three noisy pixels in the level2.evt file, extra rows are filled as -1
| Pixel properties | Quadrant properties | ||||||
|---|---|---|---|---|---|---|---|
| Quadrant | DetID | PixID | Counts | Sigma | Mean | Median | Sigma |
| A | 0 | 13 | 1750355 | 15737.24 | 493 | 482 | 111.2 |
| A | 6 | 16 | 134190 | 1202.48 | 493 | 482 | 111.2 |
| A | 5 | 168 | 91452 | 818.13 | 493 | 482 | 111.2 |
| B | 0 | 190 | 194720 | 1979.29 | 501 | 490 | 98.1 |
| B | 3 | 64 | 164708 | 1673.46 | 501 | 490 | 98.1 |
| B | 15 | 33 | 101399 | 1028.31 | 501 | 490 | 98.1 |
| C | 15 | 208 | 46448 | 387.52 | 487 | 485 | 118.6 |
| C | 8 | 128 | 15415 | 125.88 | 487 | 485 | 118.6 |
| C | 8 | 112 | 8480 | 67.41 | 487 | 485 | 118.6 |
| D | 1 | 52 | 2109279 | 17277.73 | 477 | 463 | 122.1 |
| D | 7 | 80 | 460869 | 3772.15 | 477 | 463 | 122.1 |
| D | 11 | 176 | 447558 | 3663.09 | 477 | 463 | 122.1 |
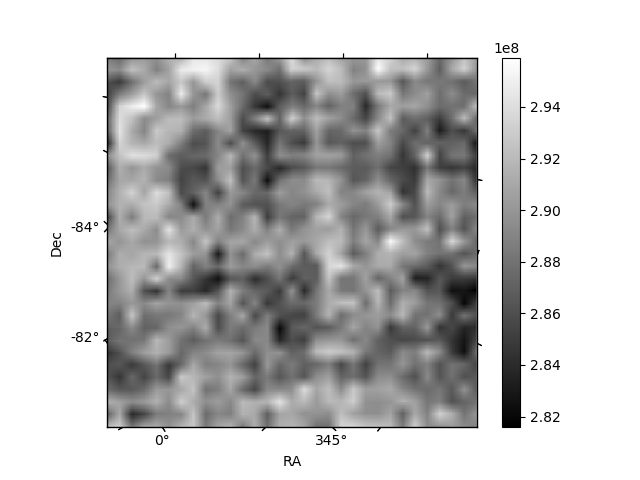
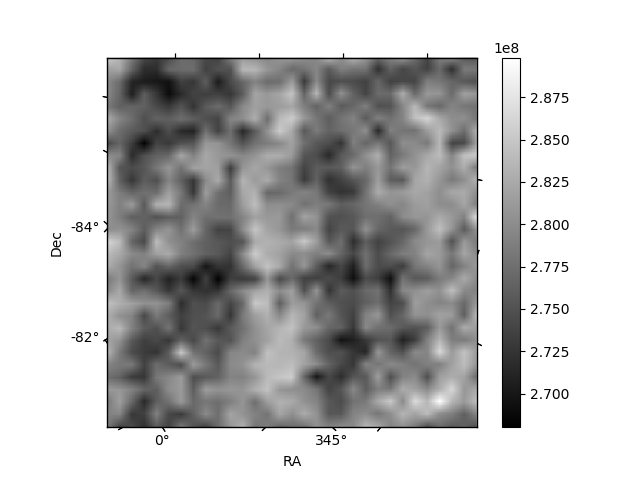
Histogram calculated using DETX and DETY for each event in the final _common_clean file
| Quadrant A | 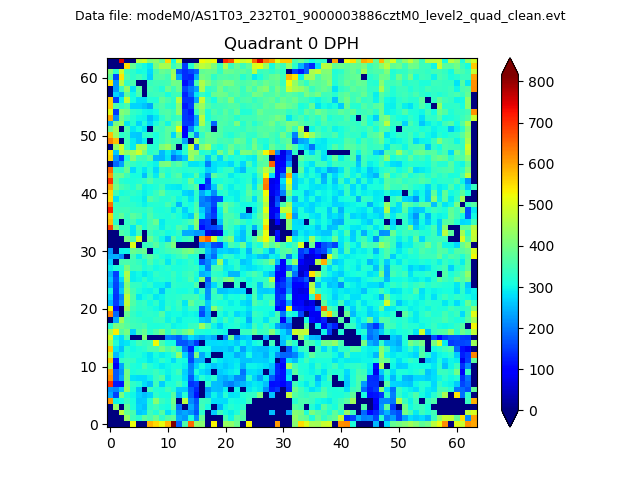 |
 |
Quadrant B |
|---|---|---|---|
| Quadrant D |  |
 |
Quadrant C |
| Plot type | Count rate plots | Images |
|---|---|---|
| Comparison with Poisson distribution Blue bars denote a histogram of data divided into 1 sec bins. Red curve is a Poisson curve with rate = median count rate of data. |
 |
 |
| Quadrant-wise count rates Data is divided into 100 sec bins |
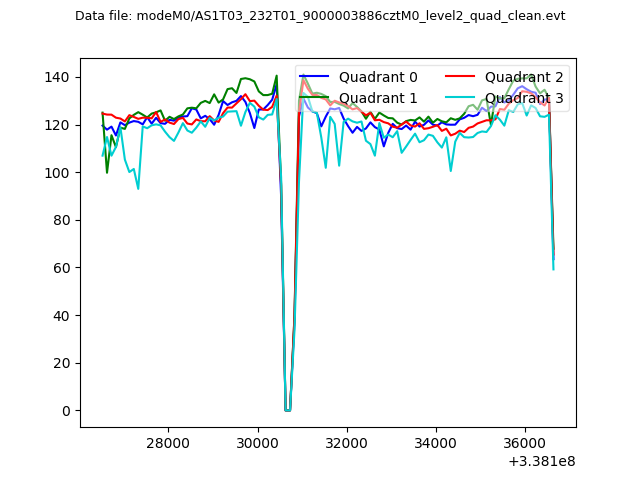 |
|
| Module-wise count rates for Quadrant A Data is divided into 100 sec bins |
 |
 |
| Module-wise count rates for Quadrant B Data is divided into 100 sec bins |
 |
 |
| Module-wise count rates for Quadrant C Data is divided into 100 sec bins |
 |
 |
| Module-wise count rates for Quadrant D Data is divided into 100 sec bins |
 |
 |
| Parameter | Plot |
|---|---|
| CZT HV Monitor |  |
| D_VDD |  |
| Temperature 1 |  |
| Veto HV Monitor |  |
| Veto LLD | 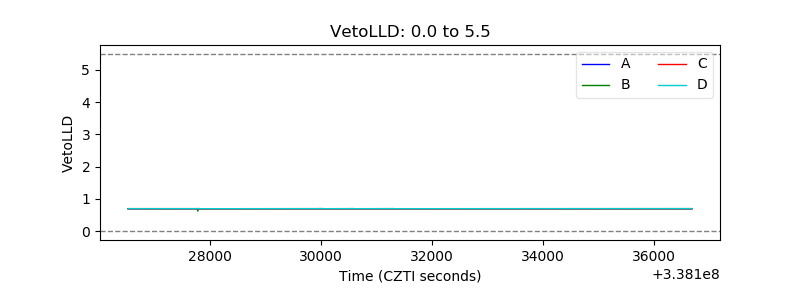 |
| Alpha Counter |  |
| _CPM_Rate | 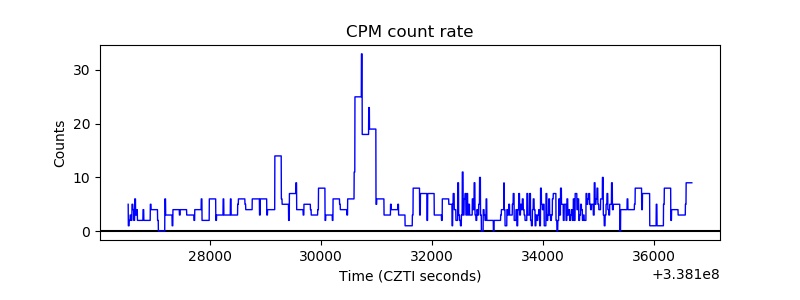 |
| CZT Counter |  |
| +2.5 Volts monitor |  |
| +5 Volts monitor | 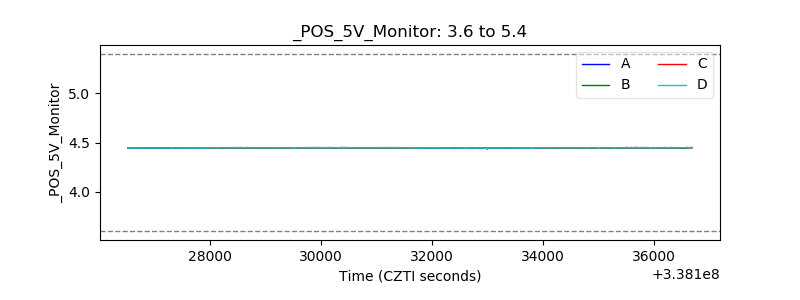 |
| _ROLL_ROT |  |
| _Roll_DEC |  |
| _Roll_RA | 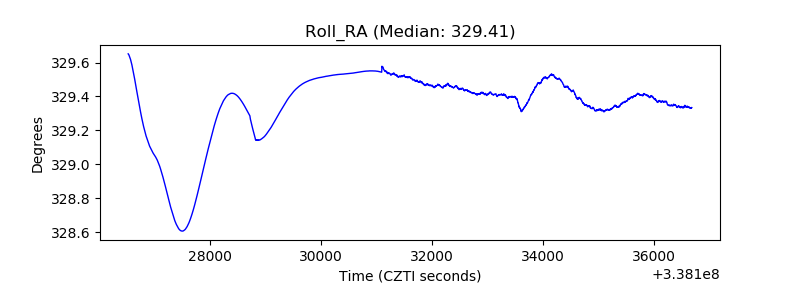 |
| Veto Counter |  |