| Param | Original file | Final file |
|---|---|---|
| Filename | modeM0/AS1T03_230T01_9000003874cztM0_level2_bc.evt | modeM0/AS1T03_230T01_9000003874cztM0_level2_quad_clean.evt |
| Size (bytes) | 530,602,560 | 219,767,040 |
| Size | 506.0 MB | 209.6 MB |
| Events in quadrant A | 4,336,563 | 1,461,388 |
| Events in quadrant B | 2,947,351 | 1,503,541 |
| Events in quadrant C | 2,285,205 | 1,470,008 |
| Events in quadrant D | 5,696,758 | 1,411,691 |
| Mode SS | |||
|---|---|---|---|
| Quadrant | BADHDUFLAG | Total packets | Discarded packets |
| A | 0 | 240 | 0 |
| B | 0 | 240 | 0 |
| C | 0 | 240 | 0 |
| D | 0 | 240 | 0 |
| Mode M9 | |||
|---|---|---|---|
| Quadrant | BADHDUFLAG | Total packets | Discarded packets |
| A | 0 | 5 | 0 |
| B | 0 | 5 | 0 |
| C | 0 | 5 | 0 |
| D | 0 | 5 | 0 |
| Mode M0 | |||
|---|---|---|---|
| Quadrant | BADHDUFLAG | Total packets | Discarded packets |
| A | 0 | 30475 | 0 |
| B | 0 | 26027 | 0 |
| C | 0 | 24060 | 0 |
| D | 0 | 35176 | 0 |
| Quadrant | Total seconds | Saturated seconds | Saturation percentage |
|---|---|---|---|
| A | 11699 | 406 | 3.470382% |
| B | 11699 | 346 | 2.957518% |
| C | 11699 | 266 | 2.273699% |
| D | 11699 | 718 | 6.137277% |
Noise dominated data is calculated using 1-second bins in cleaned event files. If a bin has >2000 counts, and if more than 50% of those come from <1% of pixels, then it is considered to be noise-dominated and hence unusable.
| Quadrant | # 1 sec bins | Bins with >0 counts | Bins with >2000 counts | High rate bins dominated by noise | Noise dominated (total time) | Noise dominated (detector-on time) | Marked lightcurve |
|---|---|---|---|---|---|---|---|
| A | 12309 | 11699 | 19 | 19 | 0.15% | 0.16% |  |
| B | 12309 | 11698 | 9 | 9 | 0.07% | 0.08% | 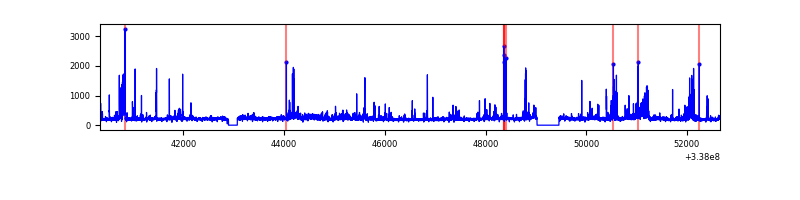 |
| C | 12309 | 11698 | 0 | 0 | 0.00% | 0.00% |  |
| D | 12309 | 11699 | 229 | 229 | 1.86% | 1.96% | 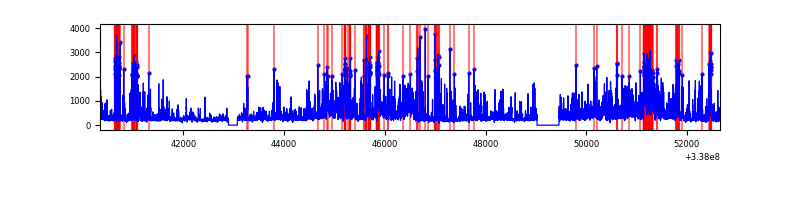 |
Top three noisy pixels from each quadrant. If the there are fewer than three noisy pixels in the level2.evt file, extra rows are filled as -1
| Pixel properties | Quadrant properties | ||||||
|---|---|---|---|---|---|---|---|
| Quadrant | DetID | PixID | Counts | Sigma | Mean | Median | Sigma |
| A | 0 | 13 | 1620369 | 12250.61 | 590 | 578 | 132.2 |
| A | 6 | 16 | 426974 | 3224.87 | 590 | 578 | 132.2 |
| A | 13 | 254 | 17726 | 129.69 | 590 | 578 | 132.2 |
| B | 3 | 64 | 278992 | 2377.53 | 600 | 585 | 117.1 |
| B | 10 | 246 | 132319 | 1124.98 | 600 | 585 | 117.1 |
| B | 15 | 33 | 90560 | 768.36 | 600 | 585 | 117.1 |
| C | 15 | 208 | 16268 | 111.8 | 583 | 580 | 140.3 |
| C | 2 | 16 | 11053 | 74.64 | 583 | 580 | 140.3 |
| C | 8 | 128 | 7027 | 45.94 | 583 | 580 | 140.3 |
| D | 7 | 80 | 1514216 | 11175.02 | 578 | 562 | 135.4 |
| D | 11 | 176 | 736438 | 5432.83 | 578 | 562 | 135.4 |
| D | 1 | 52 | 722592 | 5330.61 | 578 | 562 | 135.4 |
Histogram calculated using DETX and DETY for each event in the final _common_clean file
| Quadrant A |  |
 |
Quadrant B |
|---|---|---|---|
| Quadrant D |  |
 |
Quadrant C |
| Plot type | Count rate plots | Images |
|---|---|---|
| Comparison with Poisson distribution Blue bars denote a histogram of data divided into 1 sec bins. Red curve is a Poisson curve with rate = median count rate of data. |
 |
 |
| Quadrant-wise count rates Data is divided into 100 sec bins |
 |
|
| Module-wise count rates for Quadrant A Data is divided into 100 sec bins |
 |
 |
| Module-wise count rates for Quadrant B Data is divided into 100 sec bins |
 |
 |
| Module-wise count rates for Quadrant C Data is divided into 100 sec bins |
 |
 |
| Module-wise count rates for Quadrant D Data is divided into 100 sec bins |
 |
 |
| Parameter | Plot |
|---|---|
| CZT HV Monitor |  |
| D_VDD |  |
| Temperature 1 |  |
| Veto HV Monitor | 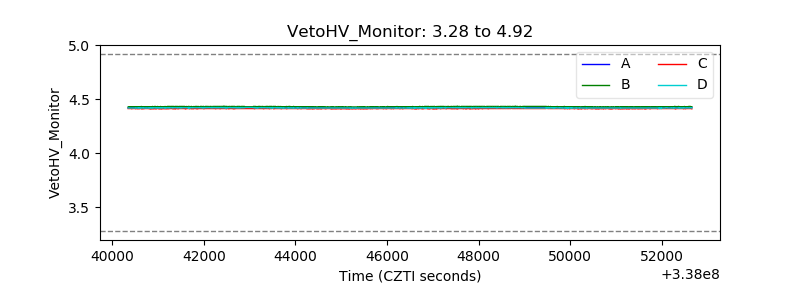 |
| Veto LLD |  |
| Alpha Counter | 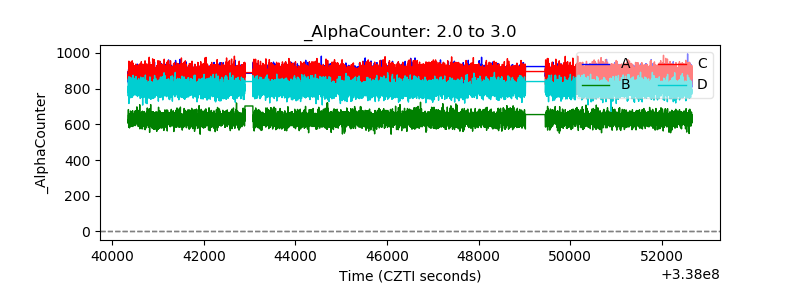 |
| _CPM_Rate |  |
| CZT Counter | 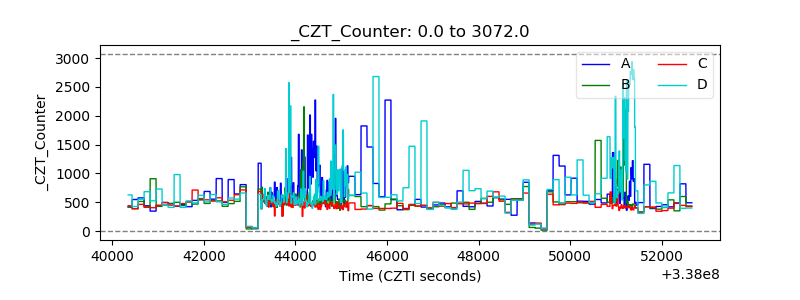 |
| +2.5 Volts monitor |  |
| +5 Volts monitor | 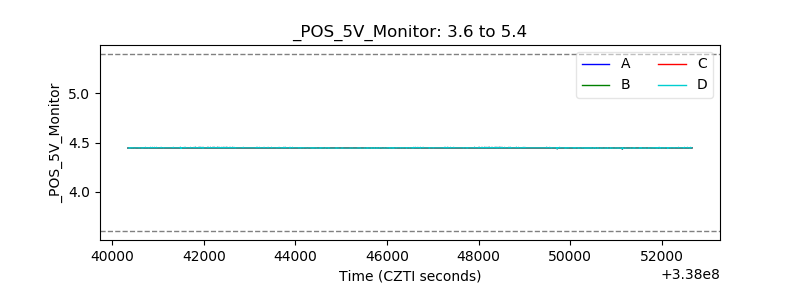 |
| _ROLL_ROT |  |
| _Roll_DEC |  |
| _Roll_RA |  |
| Veto Counter |  |