| Param | Original file | Final file |
|---|---|---|
| Filename | modeM0/AS1A09_038T21_9000003882cztM0_level2_bc.evt | modeM0/AS1A09_038T21_9000003882cztM0_level2_quad_clean.evt |
| Size (bytes) | 171,351,360 | 76,308,480 |
| Size | 163.4 MB | 72.8 MB |
| Events in quadrant A | 1,754,855 | 505,645 |
| Events in quadrant B | 968,574 | 531,349 |
| Events in quadrant C | 815,728 | 512,144 |
| Events in quadrant D | 1,381,327 | 490,813 |
| Mode M0 | |||
|---|---|---|---|
| Quadrant | BADHDUFLAG | Total packets | Discarded packets |
| A | 0 | 10926 | 0 |
| B | 0 | 8521 | 0 |
| C | 0 | 7973 | 0 |
| D | 0 | 9699 | 0 |
| Mode M9 | |||
|---|---|---|---|
| Quadrant | BADHDUFLAG | Total packets | Discarded packets |
| A | 0 | 12 | 0 |
| B | 0 | 12 | 0 |
| C | 0 | 12 | 0 |
| D | 0 | 12 | 0 |
| Mode SS | |||
|---|---|---|---|
| Quadrant | BADHDUFLAG | Total packets | Discarded packets |
| A | 0 | 76 | 0 |
| B | 0 | 76 | 0 |
| C | 0 | 76 | 0 |
| D | 0 | 76 | 0 |
| Quadrant | Total seconds | Saturated seconds | Saturation percentage |
|---|---|---|---|
| A | 3845 | 163 | 4.239272% |
| B | 3845 | 56 | 1.456437% |
| C | 3845 | 33 | 0.858257% |
| D | 3845 | 88 | 2.288687% |
Noise dominated data is calculated using 1-second bins in cleaned event files. If a bin has >2000 counts, and if more than 50% of those come from <1% of pixels, then it is considered to be noise-dominated and hence unusable.
| Quadrant | # 1 sec bins | Bins with >0 counts | Bins with >2000 counts | High rate bins dominated by noise | Noise dominated (total time) | Noise dominated (detector-on time) | Marked lightcurve |
|---|---|---|---|---|---|---|---|
| A | 4970 | 3845 | 60 | 60 | 1.21% | 1.56% |  |
| B | 4970 | 3845 | 4 | 4 | 0.08% | 0.10% | 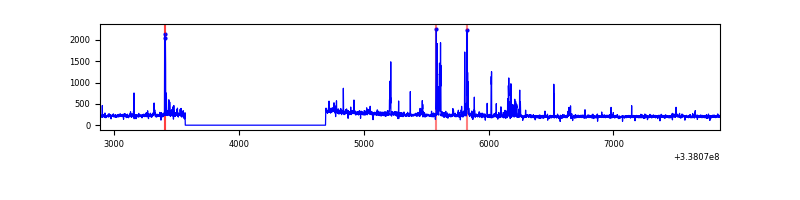 |
| C | 4970 | 3845 | 0 | 0 | 0.00% | 0.00% |  |
| D | 4970 | 3845 | 21 | 21 | 0.42% | 0.55% |  |
Top three noisy pixels from each quadrant. If the there are fewer than three noisy pixels in the level2.evt file, extra rows are filled as -1
| Pixel properties | Quadrant properties | ||||||
|---|---|---|---|---|---|---|---|
| Quadrant | DetID | PixID | Counts | Sigma | Mean | Median | Sigma |
| A | 0 | 13 | 542954 | 11367.31 | 211 | 207 | 47.7 |
| A | 6 | 16 | 397657 | 8324.21 | 211 | 207 | 47.7 |
| A | 13 | 254 | 5943 | 120.14 | 211 | 207 | 47.7 |
| B | 10 | 246 | 60395 | 1399.07 | 218 | 214 | 43.0 |
| B | 3 | 64 | 44411 | 1027.48 | 218 | 214 | 43.0 |
| B | 0 | 190 | 11396 | 259.96 | 218 | 214 | 43.0 |
| C | 15 | 208 | 4419 | 81.8 | 210 | 210 | 51.5 |
| C | 13 | 61 | 1224 | 19.71 | 210 | 210 | 51.5 |
| C | 2 | 16 | 992 | 15.2 | 210 | 210 | 51.5 |
| D | 1 | 52 | 375477 | 7650.14 | 207 | 201 | 49.1 |
| D | 2 | 250 | 96990 | 1973.08 | 207 | 201 | 49.1 |
| D | 11 | 176 | 87125 | 1771.98 | 207 | 201 | 49.1 |
Histogram calculated using DETX and DETY for each event in the final _common_clean file
| Quadrant A |  |
 |
Quadrant B |
|---|---|---|---|
| Quadrant D |  |
 |
Quadrant C |
| Plot type | Count rate plots | Images |
|---|---|---|
| Comparison with Poisson distribution Blue bars denote a histogram of data divided into 1 sec bins. Red curve is a Poisson curve with rate = median count rate of data. |
 |
 |
| Quadrant-wise count rates Data is divided into 100 sec bins |
 |
|
| Module-wise count rates for Quadrant A Data is divided into 100 sec bins |
 |
 |
| Module-wise count rates for Quadrant B Data is divided into 100 sec bins |
 |
 |
| Module-wise count rates for Quadrant C Data is divided into 100 sec bins |
 |
 |
| Module-wise count rates for Quadrant D Data is divided into 100 sec bins |
 |
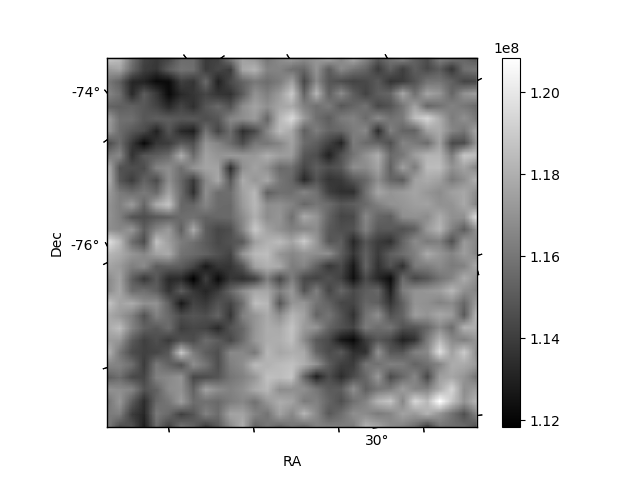 |
| Parameter | Plot |
|---|---|
| CZT HV Monitor |  |
| D_VDD |  |
| Temperature 1 |  |
| Veto HV Monitor |  |
| Veto LLD |  |
| Alpha Counter |  |
| _CPM_Rate |  |
| CZT Counter | 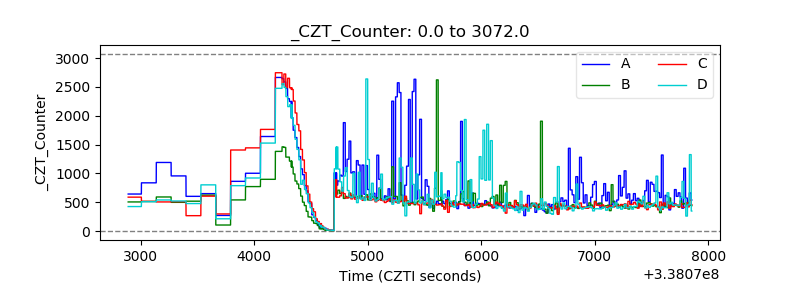 |
| +2.5 Volts monitor |  |
| +5 Volts monitor |  |
| _ROLL_ROT |  |
| _Roll_DEC |  |
| _Roll_RA |  |
| Veto Counter |  |