| Param | Original file | Final file |
|---|---|---|
| Filename | modeM0/AS1A09_038T17_9000003884cztM0_level2_bc.evt | modeM0/AS1A09_038T17_9000003884cztM0_level2_quad_clean.evt |
| Size (bytes) | 1,568,511,360 | 625,201,920 |
| Size | 1.5 GB | 596.2 MB |
| Events in quadrant A | 10,205,992 | 4,203,712 |
| Events in quadrant B | 10,412,525 | 4,233,693 |
| Events in quadrant C | 7,715,998 | 4,267,529 |
| Events in quadrant D | 16,814,831 | 3,862,281 |
| Mode SS | |||
|---|---|---|---|
| Quadrant | BADHDUFLAG | Total packets | Discarded packets |
| A | 0 | 818 | 0 |
| B | 0 | 818 | 0 |
| C | 0 | 818 | 0 |
| D | 0 | 818 | 0 |
| Mode M0 | |||
|---|---|---|---|
| Quadrant | BADHDUFLAG | Total packets | Discarded packets |
| A | 0 | 79341 | 0 |
| B | 0 | 83605 | 0 |
| C | 0 | 72224 | 0 |
| D | 0 | 111512 | 0 |
| Mode M9 | |||
|---|---|---|---|
| Quadrant | BADHDUFLAG | Total packets | Discarded packets |
| A | 0 | 77 | 0 |
| B | 0 | 77 | 0 |
| C | 0 | 77 | 0 |
| D | 0 | 77 | 0 |
| Quadrant | Total seconds | Saturated seconds | Saturation percentage |
|---|---|---|---|
| A | 34093 | 537 | 1.575103% |
| B | 34092 | 1784 | 5.232899% |
| C | 34090 | 642 | 1.883250% |
| D | 34091 | 4560 | 13.375964% |
Noise dominated data is calculated using 1-second bins in cleaned event files. If a bin has >2000 counts, and if more than 50% of those come from <1% of pixels, then it is considered to be noise-dominated and hence unusable.
| Quadrant | # 1 sec bins | Bins with >0 counts | Bins with >2000 counts | High rate bins dominated by noise | Noise dominated (total time) | Noise dominated (detector-on time) | Marked lightcurve |
|---|---|---|---|---|---|---|---|
| A | 41696 | 34087 | 14 | 14 | 0.03% | 0.04% | 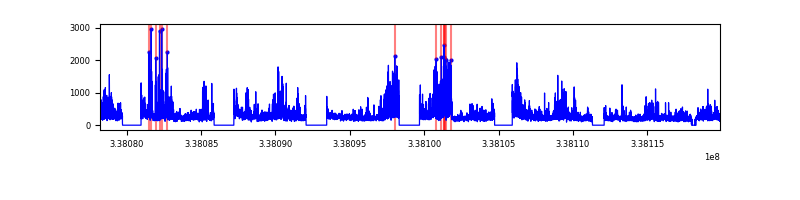 |
| B | 41696 | 34085 | 39 | 39 | 0.09% | 0.11% |  |
| C | 41696 | 34088 | 1 | 1 | 0.00% | 0.00% |  |
| D | 41696 | 34092 | 714 | 714 | 1.71% | 2.09% |  |
Top three noisy pixels from each quadrant. If the there are fewer than three noisy pixels in the level2.evt file, extra rows are filled as -1
| Pixel properties | Quadrant properties | ||||||
|---|---|---|---|---|---|---|---|
| Quadrant | DetID | PixID | Counts | Sigma | Mean | Median | Sigma |
| A | 0 | 13 | 2245661 | 5414.82 | 1968 | 1949 | 414.4 |
| A | 6 | 16 | 222307 | 531.8 | 1968 | 1949 | 414.4 |
| A | 5 | 168 | 148505 | 353.69 | 1968 | 1949 | 414.4 |
| B | 3 | 64 | 1590914 | 4330.33 | 1979 | 1943 | 366.9 |
| B | 10 | 245 | 618368 | 1679.91 | 1979 | 1943 | 366.9 |
| B | 0 | 190 | 422244 | 1145.42 | 1979 | 1943 | 366.9 |
| C | 15 | 208 | 75398 | 156.94 | 1985 | 1989 | 467.7 |
| C | 14 | 176 | 18160 | 34.57 | 1985 | 1989 | 467.7 |
| C | 13 | 61 | 11177 | 19.64 | 1985 | 1989 | 467.7 |
| D | 1 | 52 | 6396929 | 15303.79 | 1857 | 1820 | 417.9 |
| D | 7 | 80 | 2159146 | 5162.58 | 1857 | 1820 | 417.9 |
| D | 11 | 176 | 619406 | 1477.91 | 1857 | 1820 | 417.9 |
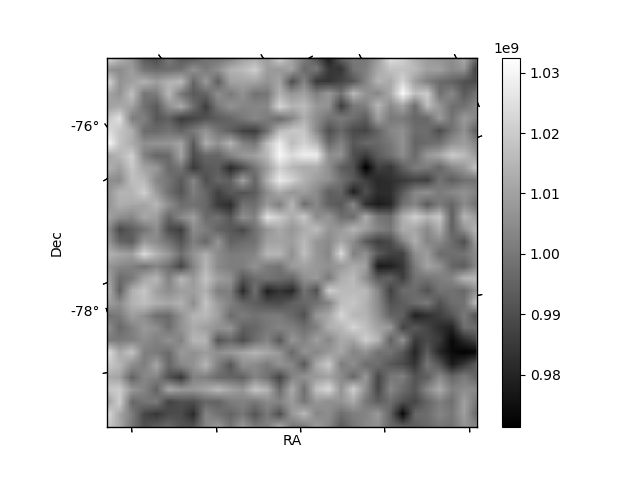
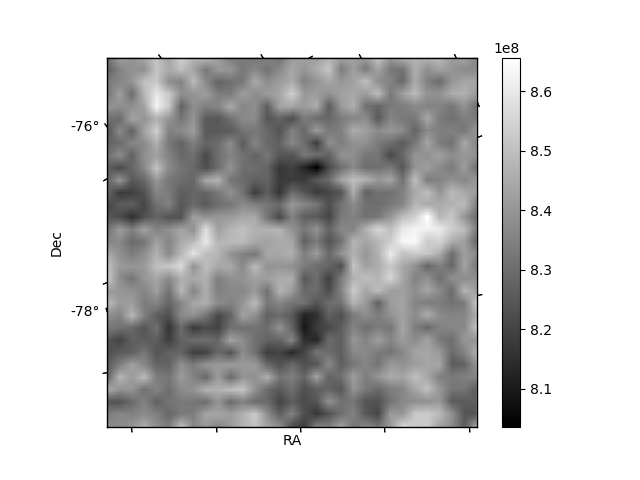
Histogram calculated using DETX and DETY for each event in the final _common_clean file
| Quadrant A | 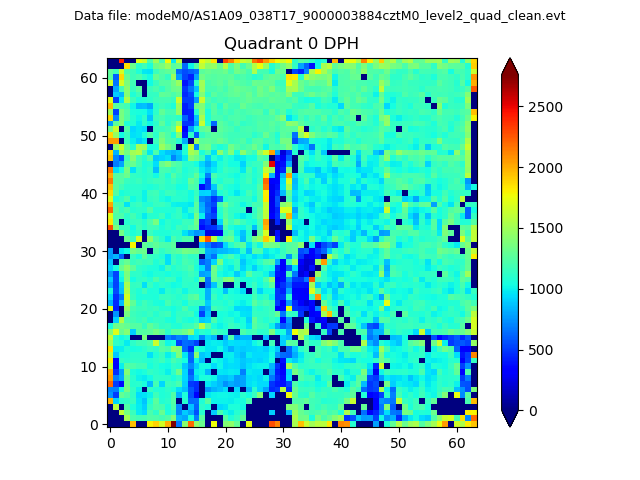 |
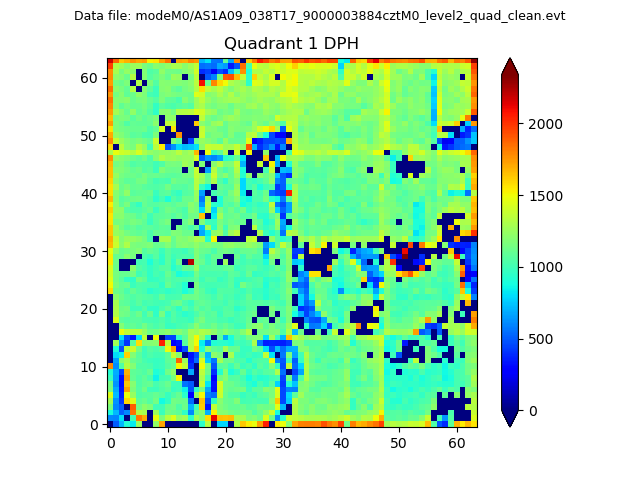 |
Quadrant B |
|---|---|---|---|
| Quadrant D |  |
 |
Quadrant C |
| Plot type | Count rate plots | Images |
|---|---|---|
| Comparison with Poisson distribution Blue bars denote a histogram of data divided into 1 sec bins. Red curve is a Poisson curve with rate = median count rate of data. |
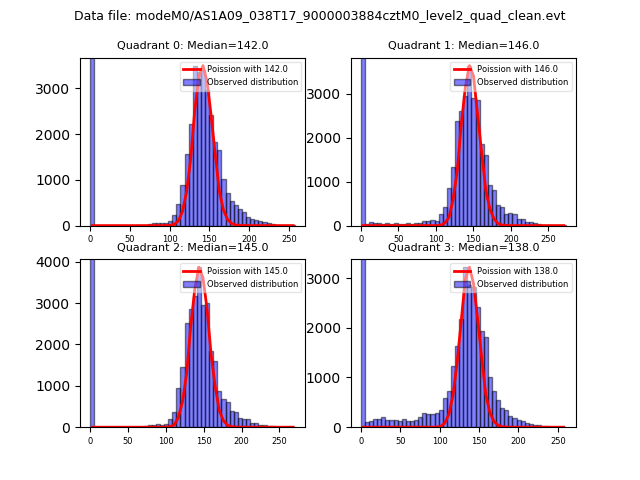 |
 |
| Quadrant-wise count rates Data is divided into 100 sec bins |
 |
|
| Module-wise count rates for Quadrant A Data is divided into 100 sec bins |
 |
 |
| Module-wise count rates for Quadrant B Data is divided into 100 sec bins |
 |
 |
| Module-wise count rates for Quadrant C Data is divided into 100 sec bins |
 |
 |
| Module-wise count rates for Quadrant D Data is divided into 100 sec bins |
 |
 |
| Parameter | Plot |
|---|---|
| CZT HV Monitor |  |
| D_VDD |  |
| Temperature 1 |  |
| Veto HV Monitor |  |
| Veto LLD |  |
| Alpha Counter | 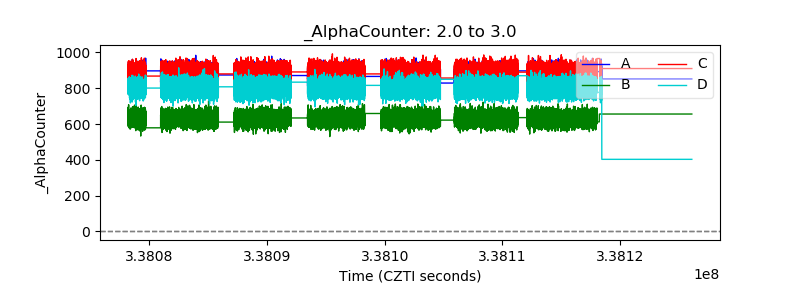 |
| _CPM_Rate | 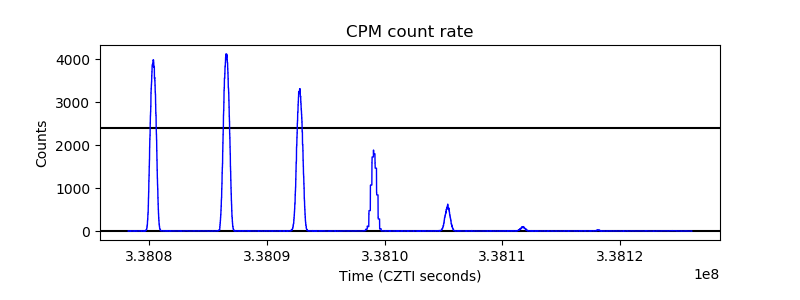 |
| CZT Counter |  |
| +2.5 Volts monitor |  |
| +5 Volts monitor |  |
| _ROLL_ROT | 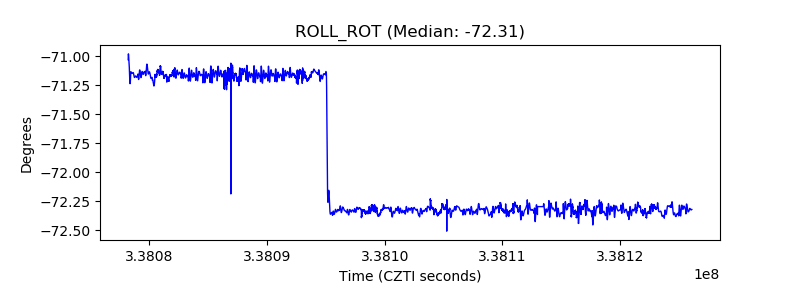 |
| _Roll_DEC |  |
| _Roll_RA |  |
| Veto Counter | 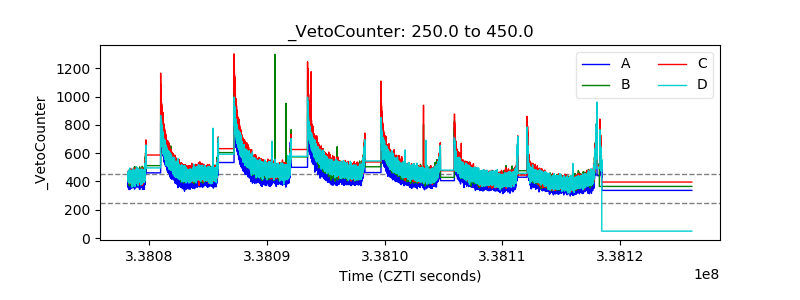 |