| Param | Original file | Final file |
|---|---|---|
| Filename | modeM0/AS1A09_038T12_9000003880cztM0_level2_bc.evt | modeM0/AS1A09_038T12_9000003880cztM0_level2_quad_clean.evt |
| Size (bytes) | 313,741,440 | 77,958,720 |
| Size | 299.2 MB | 74.3 MB |
| Events in quadrant A | 2,612,964 | 513,591 |
| Events in quadrant B | 2,987,277 | 481,590 |
| Events in quadrant C | 1,001,735 | 520,230 |
| Events in quadrant D | 2,553,734 | 495,777 |
| Mode M9 | |||
|---|---|---|---|
| Quadrant | BADHDUFLAG | Total packets | Discarded packets |
| A | 0 | 10 | 0 |
| B | 0 | 10 | 0 |
| C | 0 | 10 | 0 |
| D | 0 | 10 | 0 |
| Mode M0 | |||
|---|---|---|---|
| Quadrant | BADHDUFLAG | Total packets | Discarded packets |
| A | 0 | 15292 | 0 |
| B | 0 | 17777 | 0 |
| C | 0 | 10224 | 0 |
| D | 0 | 15391 | 0 |
| Mode SS | |||
|---|---|---|---|
| Quadrant | BADHDUFLAG | Total packets | Discarded packets |
| A | 0 | 100 | 0 |
| B | 0 | 100 | 0 |
| C | 0 | 100 | 0 |
| D | 0 | 100 | 0 |
| Quadrant | Total seconds | Saturated seconds | Saturation percentage |
|---|---|---|---|
| A | 4984 | 263 | 5.276886% |
| B | 4984 | 907 | 18.198234% |
| C | 4984 | 38 | 0.762440% |
| D | 4984 | 407 | 8.166132% |
Noise dominated data is calculated using 1-second bins in cleaned event files. If a bin has >2000 counts, and if more than 50% of those come from <1% of pixels, then it is considered to be noise-dominated and hence unusable.
| Quadrant | # 1 sec bins | Bins with >0 counts | Bins with >2000 counts | High rate bins dominated by noise | Noise dominated (total time) | Noise dominated (detector-on time) | Marked lightcurve |
|---|---|---|---|---|---|---|---|
| A | 5979 | 4984 | 64 | 64 | 1.07% | 1.28% | 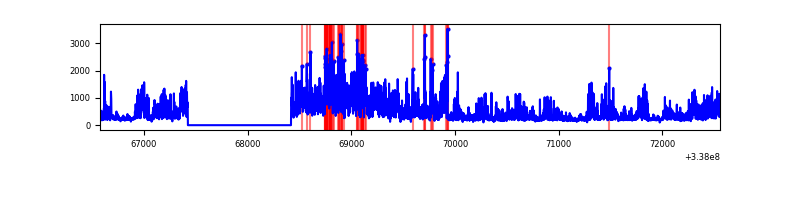 |
| B | 5979 | 4984 | 279 | 279 | 4.67% | 5.60% |  |
| C | 5979 | 4984 | 0 | 0 | 0.00% | 0.00% |  |
| D | 5979 | 4984 | 165 | 165 | 2.76% | 3.31% |  |
Top three noisy pixels from each quadrant. If the there are fewer than three noisy pixels in the level2.evt file, extra rows are filled as -1
| Pixel properties | Quadrant properties | ||||||
|---|---|---|---|---|---|---|---|
| Quadrant | DetID | PixID | Counts | Sigma | Mean | Median | Sigma |
| A | 0 | 13 | 1070689 | 18700.11 | 255 | 250 | 57.2 |
| A | 6 | 16 | 553982 | 9673.46 | 255 | 250 | 57.2 |
| A | 13 | 254 | 7631 | 128.94 | 255 | 250 | 57.2 |
| B | 3 | 64 | 1936365 | 39131.18 | 243 | 238 | 49.5 |
| B | 0 | 190 | 44773 | 900.1 | 243 | 238 | 49.5 |
| B | 10 | 246 | 38114 | 765.51 | 243 | 238 | 49.5 |
| C | 15 | 208 | 22319 | 355.21 | 254 | 252 | 62.1 |
| C | 3 | 233 | 2550 | 36.99 | 254 | 252 | 62.1 |
| C | 13 | 61 | 1371 | 18.01 | 254 | 252 | 62.1 |
| D | 1 | 52 | 1369378 | 23437.82 | 245 | 239 | 58.4 |
| D | 2 | 250 | 130279 | 2226.11 | 245 | 239 | 58.4 |
| D | 11 | 176 | 48658 | 828.87 | 245 | 239 | 58.4 |
Histogram calculated using DETX and DETY for each event in the final _common_clean file
| Quadrant A | 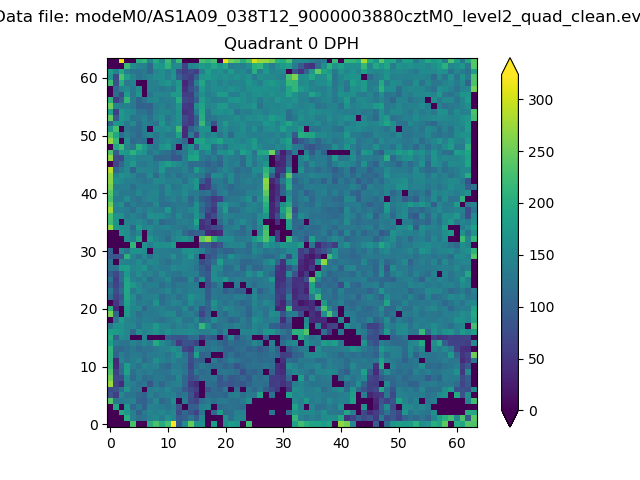 |
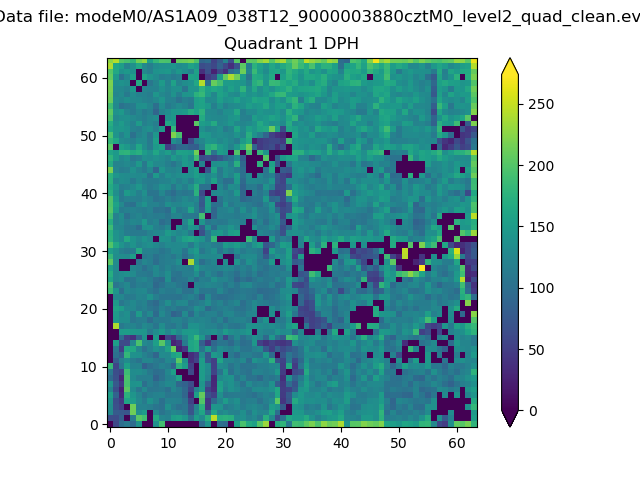 |
Quadrant B |
|---|---|---|---|
| Quadrant D |  |
 |
Quadrant C |
| Plot type | Count rate plots | Images |
|---|---|---|
| Comparison with Poisson distribution Blue bars denote a histogram of data divided into 1 sec bins. Red curve is a Poisson curve with rate = median count rate of data. |
 |
 |
| Quadrant-wise count rates Data is divided into 100 sec bins |
 |
|
| Module-wise count rates for Quadrant A Data is divided into 100 sec bins |
 |
 |
| Module-wise count rates for Quadrant B Data is divided into 100 sec bins |
 |
 |
| Module-wise count rates for Quadrant C Data is divided into 100 sec bins |
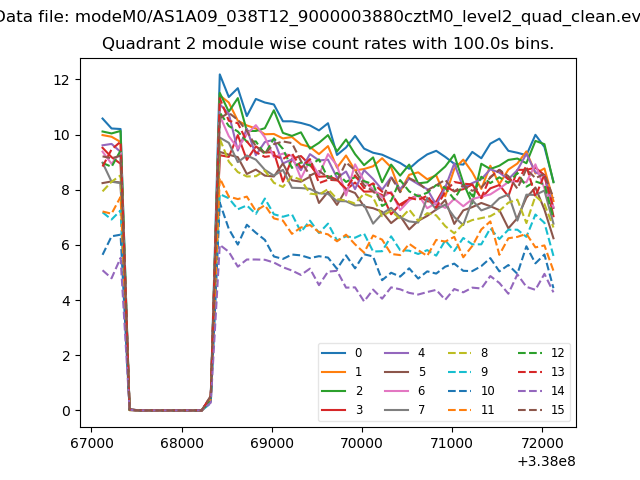 |
 |
| Module-wise count rates for Quadrant D Data is divided into 100 sec bins |
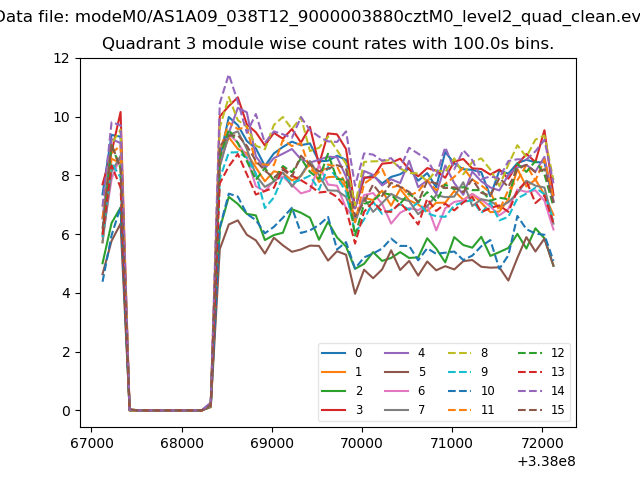 |
 |
| Parameter | Plot |
|---|---|
| CZT HV Monitor |  |
| D_VDD |  |
| Temperature 1 | 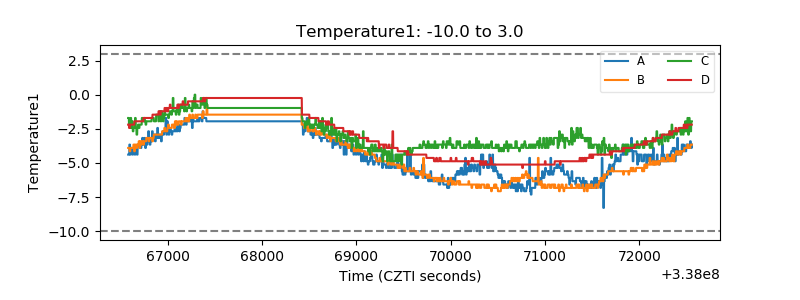 |
| Veto HV Monitor |  |
| Veto LLD |  |
| Alpha Counter |  |
| _CPM_Rate | 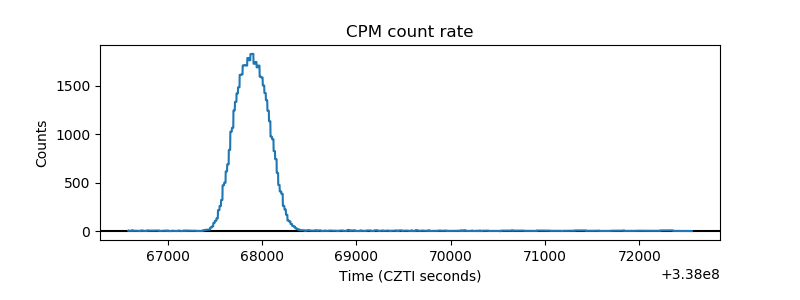 |
| CZT Counter |  |
| +2.5 Volts monitor |  |
| +5 Volts monitor |  |
| _ROLL_ROT |  |
| _Roll_DEC |  |
| _Roll_RA |  |
| Veto Counter |  |