| Param | Original file | Final file |
|---|---|---|
| Filename | modeM0/AS1A09_038T11_9000003878cztM0_level2_bc.evt | modeM0/AS1A09_038T11_9000003878cztM0_level2_quad_clean.evt |
| Size (bytes) | 206,686,080 | 77,641,920 |
| Size | 197.1 MB | 74.0 MB |
| Events in quadrant A | 2,625,365 | 506,026 |
| Events in quadrant B | 1,077,063 | 536,080 |
| Events in quadrant C | 788,093 | 514,219 |
| Events in quadrant D | 1,476,750 | 500,184 |
| Mode SS | |||
|---|---|---|---|
| Quadrant | BADHDUFLAG | Total packets | Discarded packets |
| A | 0 | 84 | 0 |
| B | 0 | 84 | 0 |
| C | 0 | 84 | 0 |
| D | 0 | 84 | 0 |
| Mode M0 | |||
|---|---|---|---|
| Quadrant | BADHDUFLAG | Total packets | Discarded packets |
| A | 0 | 14277 | 0 |
| B | 0 | 9600 | 0 |
| C | 0 | 8467 | 0 |
| D | 0 | 10653 | 0 |
| Mode M9 | |||
|---|---|---|---|
| Quadrant | BADHDUFLAG | Total packets | Discarded packets |
| A | 0 | 8 | 0 |
| B | 0 | 8 | 0 |
| C | 0 | 8 | 0 |
| D | 0 | 8 | 0 |
| Quadrant | Total seconds | Saturated seconds | Saturation percentage |
|---|---|---|---|
| A | 4189 | 244 | 5.824779% |
| B | 4189 | 62 | 1.480067% |
| C | 4189 | 30 | 0.716161% |
| D | 4189 | 86 | 2.052996% |
Noise dominated data is calculated using 1-second bins in cleaned event files. If a bin has >2000 counts, and if more than 50% of those come from <1% of pixels, then it is considered to be noise-dominated and hence unusable.
| Quadrant | # 1 sec bins | Bins with >0 counts | Bins with >2000 counts | High rate bins dominated by noise | Noise dominated (total time) | Noise dominated (detector-on time) | Marked lightcurve |
|---|---|---|---|---|---|---|---|
| A | 4979 | 4188 | 23 | 23 | 0.46% | 0.55% |  |
| B | 4979 | 4188 | 1 | 1 | 0.02% | 0.02% |  |
| C | 4979 | 4189 | 0 | 0 | 0.00% | 0.00% |  |
| D | 4979 | 4188 | 11 | 11 | 0.22% | 0.26% | 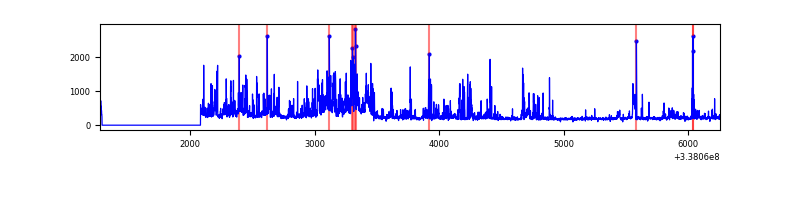 |
Top three noisy pixels from each quadrant. If the there are fewer than three noisy pixels in the level2.evt file, extra rows are filled as -1
| Pixel properties | Quadrant properties | ||||||
|---|---|---|---|---|---|---|---|
| Quadrant | DetID | PixID | Counts | Sigma | Mean | Median | Sigma |
| A | 0 | 13 | 1229845 | 26012.37 | 205 | 201 | 47.3 |
| A | 6 | 16 | 584873 | 12368.38 | 205 | 201 | 47.3 |
| A | 7 | 192 | 9037 | 186.92 | 205 | 201 | 47.3 |
| B | 0 | 190 | 160228 | 3602.32 | 213 | 207 | 44.4 |
| B | 3 | 64 | 45728 | 1024.75 | 213 | 207 | 44.4 |
| B | 10 | 246 | 40144 | 899.04 | 213 | 207 | 44.4 |
| C | 3 | 233 | 4136 | 78.48 | 203 | 202 | 50.1 |
| C | 15 | 208 | 2086 | 37.59 | 203 | 202 | 50.1 |
| C | 13 | 61 | 1173 | 19.37 | 203 | 202 | 50.1 |
| D | 1 | 52 | 424531 | 8714.85 | 203 | 196 | 48.7 |
| D | 2 | 250 | 105944 | 2171.81 | 203 | 196 | 48.7 |
| D | 11 | 176 | 85488 | 1751.69 | 203 | 196 | 48.7 |
Histogram calculated using DETX and DETY for each event in the final _common_clean file
| Quadrant A |  |
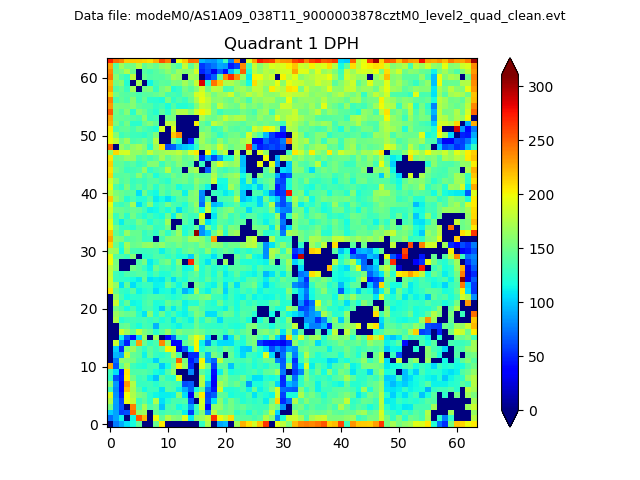 |
Quadrant B |
|---|---|---|---|
| Quadrant D |  |
 |
Quadrant C |
| Plot type | Count rate plots | Images |
|---|---|---|
| Comparison with Poisson distribution Blue bars denote a histogram of data divided into 1 sec bins. Red curve is a Poisson curve with rate = median count rate of data. |
 |
 |
| Quadrant-wise count rates Data is divided into 100 sec bins |
 |
|
| Module-wise count rates for Quadrant A Data is divided into 100 sec bins |
 |
 |
| Module-wise count rates for Quadrant B Data is divided into 100 sec bins |
 |
 |
| Module-wise count rates for Quadrant C Data is divided into 100 sec bins |
 |
 |
| Module-wise count rates for Quadrant D Data is divided into 100 sec bins |
 |
 |
| Parameter | Plot |
|---|---|
| CZT HV Monitor |  |
| D_VDD |  |
| Temperature 1 |  |
| Veto HV Monitor |  |
| Veto LLD |  |
| Alpha Counter |  |
| _CPM_Rate |  |
| CZT Counter |  |
| +2.5 Volts monitor |  |
| +5 Volts monitor |  |
| _ROLL_ROT |  |
| _Roll_DEC | 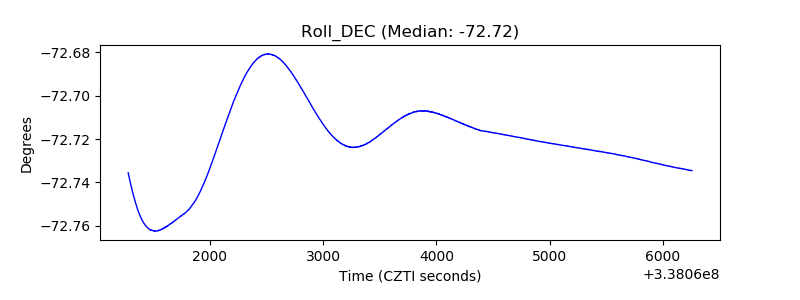 |
| _Roll_RA | 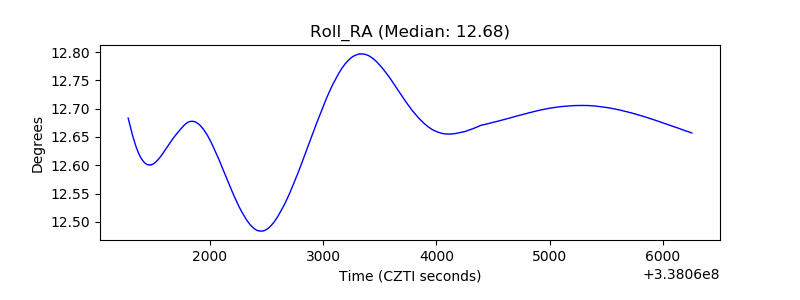 |
| Veto Counter | 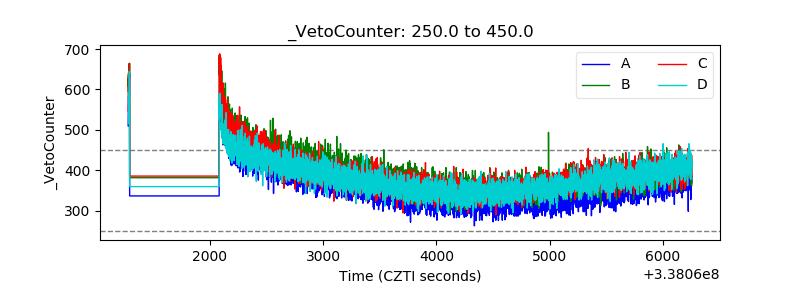 |