| Param | Original file | Final file |
|---|---|---|
| Filename | modeM0/AS1T03_224T01_9000003872cztM0_level2_bc.evt | modeM0/AS1T03_224T01_9000003872cztM0_level2_quad_clean.evt |
| Size (bytes) | 4,587,189,120 | 1,283,405,760 |
| Size | 4.3 GB | 1.2 GB |
| Events in quadrant A | 32,075,340 | 8,187,886 |
| Events in quadrant B | 30,199,818 | 8,408,882 |
| Events in quadrant C | 21,180,691 | 8,201,463 |
| Events in quadrant D | 48,741,185 | 7,297,154 |
| Mode M0 | |||
|---|---|---|---|
| Quadrant | BADHDUFLAG | Total packets | Discarded packets |
| A | 0 | 243101 | 0 |
| B | 0 | 236813 | 0 |
| C | 0 | 208464 | 0 |
| D | 0 | 326020 | 0 |
| Mode SS | |||
|---|---|---|---|
| Quadrant | BADHDUFLAG | Total packets | Discarded packets |
| A | 0 | 2016 | 0 |
| B | 0 | 2016 | 0 |
| C | 0 | 2016 | 0 |
| D | 0 | 2016 | 0 |
| Mode M9 | |||
|---|---|---|---|
| Quadrant | BADHDUFLAG | Total packets | Discarded packets |
| A | 0 | 155 | 0 |
| B | 0 | 155 | 0 |
| C | 0 | 155 | 0 |
| D | 0 | 155 | 0 |
| Quadrant | Total seconds | Saturated seconds | Saturation percentage |
|---|---|---|---|
| A | 98849 | 2947 | 2.981315% |
| B | 98849 | 3218 | 3.255470% |
| C | 98849 | 2029 | 2.052626% |
| D | 98849 | 13211 | 13.364829% |
Noise dominated data is calculated using 1-second bins in cleaned event files. If a bin has >2000 counts, and if more than 50% of those come from <1% of pixels, then it is considered to be noise-dominated and hence unusable.
| Quadrant | # 1 sec bins | Bins with >0 counts | Bins with >2000 counts | High rate bins dominated by noise | Noise dominated (total time) | Noise dominated (detector-on time) | Marked lightcurve |
|---|---|---|---|---|---|---|---|
| A | 114299 | 98846 | 247 | 247 | 0.22% | 0.25% |  |
| B | 114299 | 98839 | 391 | 391 | 0.34% | 0.40% |  |
| C | 114299 | 98847 | 6 | 6 | 0.01% | 0.01% |  |
| D | 114299 | 98735 | 1852 | 1852 | 1.62% | 1.88% | 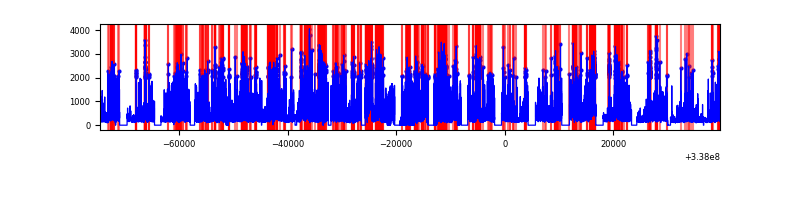 |
Top three noisy pixels from each quadrant. If the there are fewer than three noisy pixels in the level2.evt file, extra rows are filled as -1
| Pixel properties | Quadrant properties | ||||||
|---|---|---|---|---|---|---|---|
| Quadrant | DetID | PixID | Counts | Sigma | Mean | Median | Sigma |
| A | 0 | 13 | 10758260 | 9333.05 | 5429 | 5340 | 1152.1 |
| A | 6 | 16 | 278810 | 237.36 | 5429 | 5340 | 1152.1 |
| A | 13 | 254 | 150516 | 126.01 | 5429 | 5340 | 1152.1 |
| B | 3 | 64 | 2872389 | 2771.97 | 5540 | 5420 | 1034.3 |
| B | 0 | 189 | 2812074 | 2713.66 | 5540 | 5420 | 1034.3 |
| B | 0 | 190 | 1404948 | 1353.16 | 5540 | 5420 | 1034.3 |
| C | 0 | 79 | 315396 | 249.28 | 5332 | 5323 | 1243.9 |
| C | 15 | 208 | 138789 | 107.3 | 5332 | 5323 | 1243.9 |
| C | 3 | 233 | 128592 | 99.1 | 5332 | 5323 | 1243.9 |
| D | 7 | 80 | 20158697 | 18035.08 | 4967 | 4848 | 1117.5 |
| D | 1 | 52 | 3070698 | 2743.54 | 4967 | 4848 | 1117.5 |
| D | 2 | 250 | 2272367 | 2029.13 | 4967 | 4848 | 1117.5 |
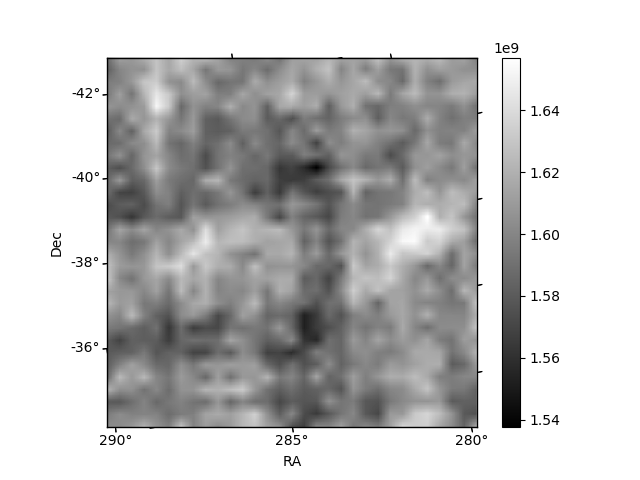
Histogram calculated using DETX and DETY for each event in the final _common_clean file
| Quadrant A |  |
 |
Quadrant B |
|---|---|---|---|
| Quadrant D |  |
 |
Quadrant C |
| Plot type | Count rate plots | Images |
|---|---|---|
| Comparison with Poisson distribution Blue bars denote a histogram of data divided into 1 sec bins. Red curve is a Poisson curve with rate = median count rate of data. |
 |
 |
| Quadrant-wise count rates Data is divided into 100 sec bins |
 |
|
| Module-wise count rates for Quadrant A Data is divided into 100 sec bins |
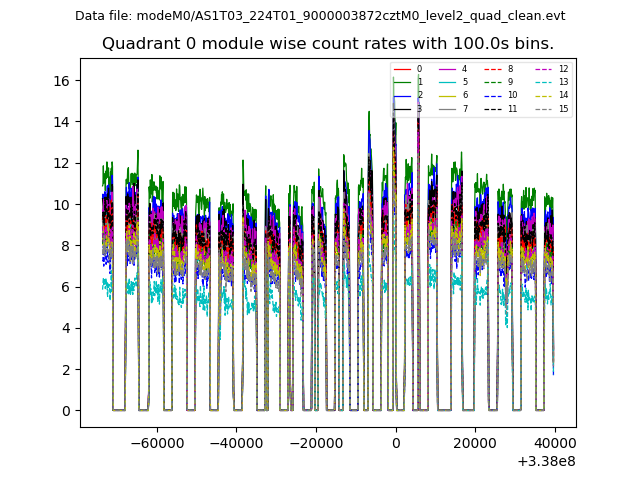 |
 |
| Module-wise count rates for Quadrant B Data is divided into 100 sec bins |
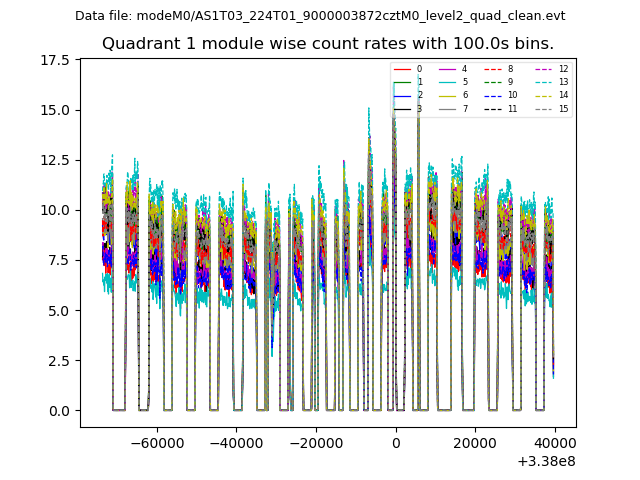 |
 |
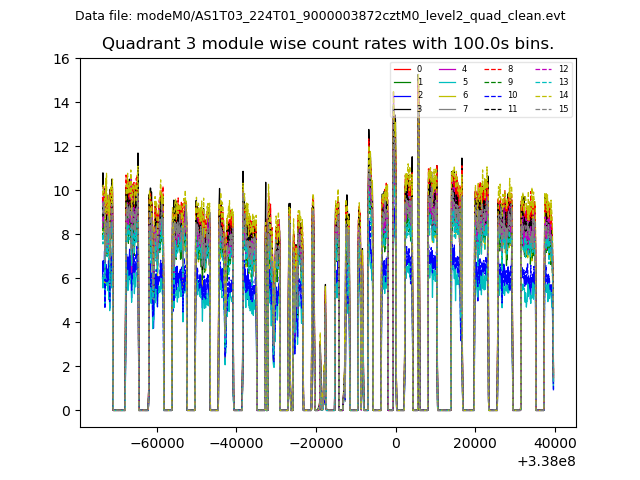
| Module-wise count rates for Quadrant C Data is divided into 100 sec bins |
 |
 |
| Module-wise count rates for Quadrant D Data is divided into 100 sec bins |
 |
 |
| Parameter | Plot |
|---|---|
| CZT HV Monitor |  |
| D_VDD | 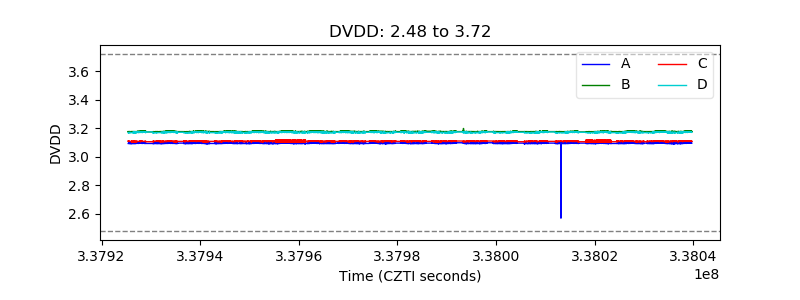 |
| Temperature 1 |  |
| Veto HV Monitor |  |
| Veto LLD |  |
| Alpha Counter | 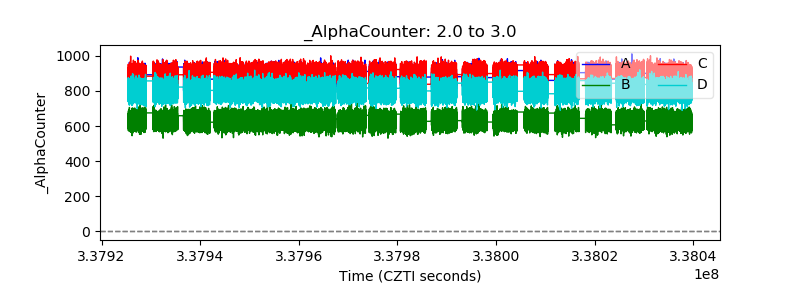 |
| _CPM_Rate |  |
| CZT Counter |  |
| +2.5 Volts monitor |  |
| +5 Volts monitor |  |
| _ROLL_ROT |  |
| _Roll_DEC |  |
| _Roll_RA |  |
| Veto Counter |  |