| Param | Original file | Final file |
|---|---|---|
| Filename | modeM0/AS1T03_224T01_9000003868cztM0_level2_bc.evt | modeM0/AS1T03_224T01_9000003868cztM0_level2_quad_clean.evt |
| Size (bytes) | 4,501,494,720 | 1,120,766,400 |
| Size | 4.2 GB | 1.0 GB |
| Events in quadrant A | 30,523,745 | 7,189,108 |
| Events in quadrant B | 42,302,190 | 6,982,926 |
| Events in quadrant C | 18,380,772 | 7,183,672 |
| Events in quadrant D | 39,152,750 | 6,568,234 |
| Mode M0 | |||
|---|---|---|---|
| Quadrant | BADHDUFLAG | Total packets | Discarded packets |
| A | 0 | 222841 | 0 |
| B | 0 | 265217 | 0 |
| C | 0 | 183870 | 0 |
| D | 0 | 261412 | 0 |
| Mode SS | |||
|---|---|---|---|
| Quadrant | BADHDUFLAG | Total packets | Discarded packets |
| A | 0 | 1784 | 0 |
| B | 0 | 1784 | 0 |
| C | 0 | 1784 | 0 |
| D | 0 | 1784 | 0 |
| Mode M9 | |||
|---|---|---|---|
| Quadrant | BADHDUFLAG | Total packets | Discarded packets |
| A | 0 | 146 | 0 |
| B | 0 | 146 | 0 |
| C | 0 | 146 | 0 |
| D | 0 | 146 | 0 |
| Quadrant | Total seconds | Saturated seconds | Saturation percentage |
|---|---|---|---|
| A | 87800 | 1926 | 2.193622% |
| B | 87800 | 9846 | 11.214123% |
| C | 87800 | 1346 | 1.533030% |
| D | 87800 | 6598 | 7.514806% |
Noise dominated data is calculated using 1-second bins in cleaned event files. If a bin has >2000 counts, and if more than 50% of those come from <1% of pixels, then it is considered to be noise-dominated and hence unusable.
| Quadrant | # 1 sec bins | Bins with >0 counts | Bins with >2000 counts | High rate bins dominated by noise | Noise dominated (total time) | Noise dominated (detector-on time) | Marked lightcurve |
|---|---|---|---|---|---|---|---|
| A | 102094 | 87799 | 148 | 148 | 0.14% | 0.17% |  |
| B | 102094 | 87798 | 3855 | 3855 | 3.78% | 4.39% |  |
| C | 102095 | 87801 | 3 | 3 | 0.00% | 0.00% |  |
| D | 102094 | 87786 | 1344 | 1344 | 1.32% | 1.53% |  |
Top three noisy pixels from each quadrant. If the there are fewer than three noisy pixels in the level2.evt file, extra rows are filled as -1
| Pixel properties | Quadrant properties | ||||||
|---|---|---|---|---|---|---|---|
| Quadrant | DetID | PixID | Counts | Sigma | Mean | Median | Sigma |
| A | 0 | 13 | 11881030 | 11456.65 | 4805 | 4725 | 1036.6 |
| A | 13 | 254 | 134764 | 125.44 | 4805 | 4725 | 1036.6 |
| A | 12 | 96 | 81943 | 74.49 | 4805 | 4725 | 1036.6 |
| B | 0 | 189 | 21003884 | 23580.4 | 4752 | 4641 | 890.5 |
| B | 10 | 246 | 1192207 | 1333.54 | 4752 | 4641 | 890.5 |
| B | 3 | 64 | 827440 | 923.93 | 4752 | 4641 | 890.5 |
| C | 15 | 208 | 119653 | 104.17 | 4712 | 4694 | 1103.6 |
| C | 7 | 87 | 92793 | 79.83 | 4712 | 4694 | 1103.6 |
| C | 13 | 61 | 26701 | 19.94 | 4712 | 4694 | 1103.6 |
| D | 7 | 80 | 11059227 | 10747.39 | 4550 | 4439 | 1028.6 |
| D | 1 | 52 | 7879849 | 7656.42 | 4550 | 4439 | 1028.6 |
| D | 2 | 250 | 1460058 | 1415.14 | 4550 | 4439 | 1028.6 |
Histogram calculated using DETX and DETY for each event in the final _common_clean file
| Quadrant A | 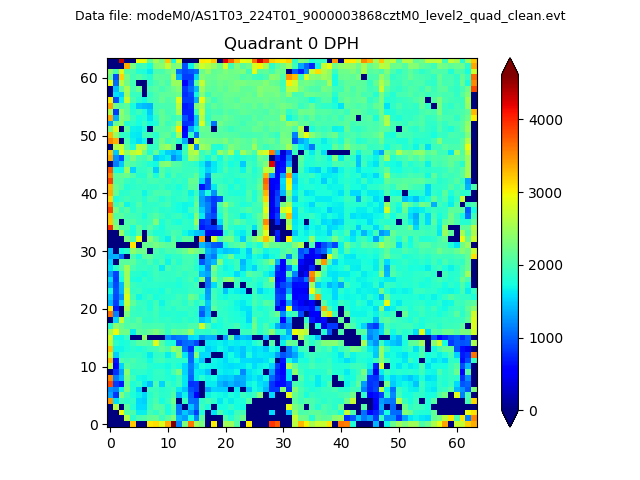 |
 |
Quadrant B |
|---|---|---|---|
| Quadrant D |  |
 |
Quadrant C |
| Plot type | Count rate plots | Images |
|---|---|---|
| Comparison with Poisson distribution Blue bars denote a histogram of data divided into 1 sec bins. Red curve is a Poisson curve with rate = median count rate of data. |
 |
 |
| Quadrant-wise count rates Data is divided into 100 sec bins |
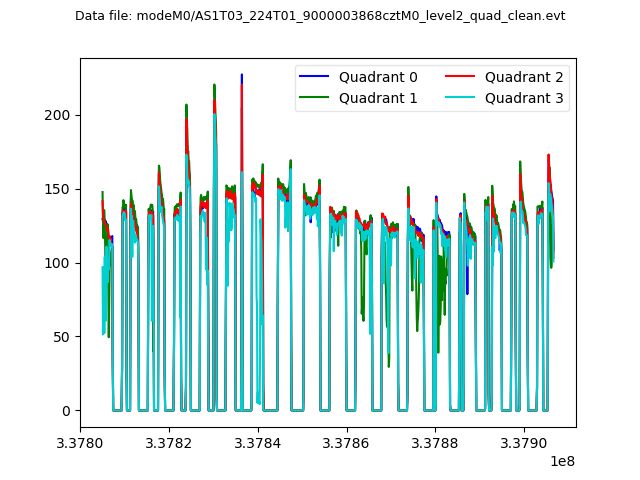 |
|
| Module-wise count rates for Quadrant A Data is divided into 100 sec bins |
 |
 |
| Module-wise count rates for Quadrant B Data is divided into 100 sec bins |
 |
 |
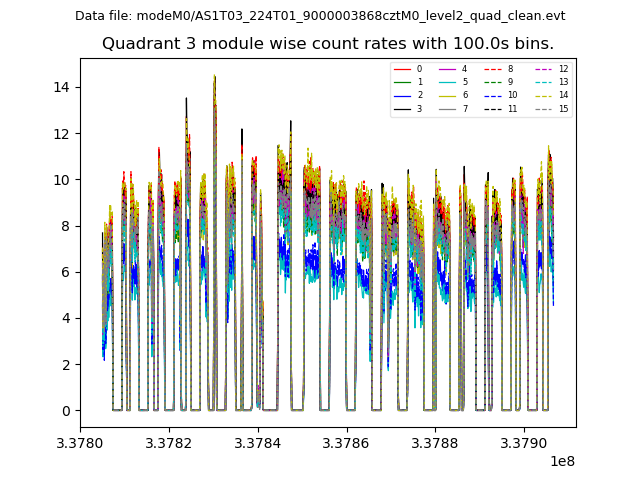
| Module-wise count rates for Quadrant C Data is divided into 100 sec bins |
 |
 |
| Module-wise count rates for Quadrant D Data is divided into 100 sec bins |
 |
 |
| Parameter | Plot |
|---|---|
| CZT HV Monitor |  |
| D_VDD | 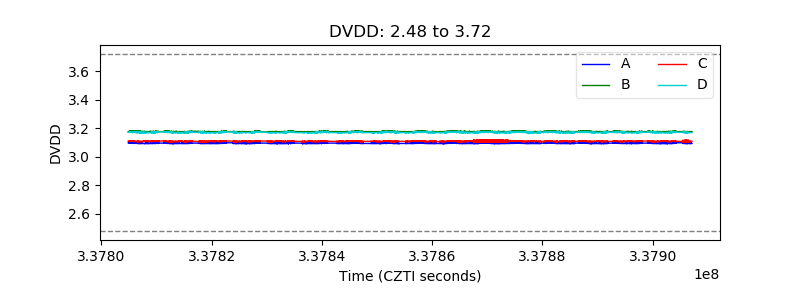 |
| Temperature 1 |  |
| Veto HV Monitor |  |
| Veto LLD |  |
| Alpha Counter |  |
| _CPM_Rate |  |
| CZT Counter |  |
| +2.5 Volts monitor |  |
| +5 Volts monitor | 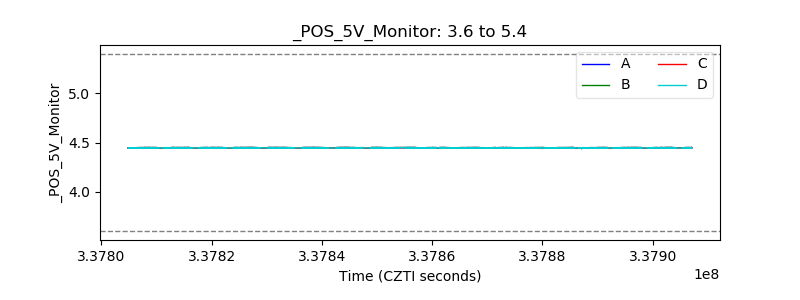 |
| _ROLL_ROT |  |
| _Roll_DEC |  |
| _Roll_RA |  |
| Veto Counter | 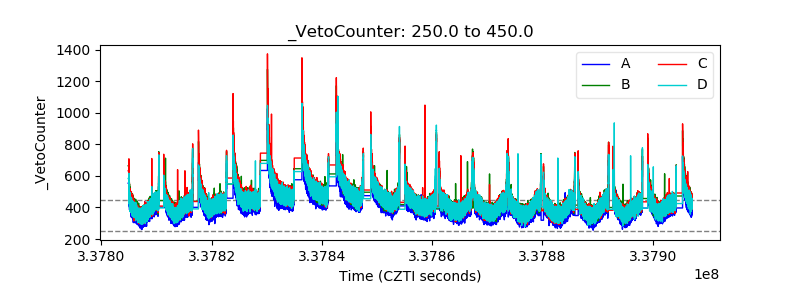 |