| Param | Original file | Final file |
|---|---|---|
| Filename | modeM0/AS1A09_079T01_9000003864cztM0_level2_bc.evt | modeM0/AS1A09_079T01_9000003864cztM0_level2_quad_clean.evt |
| Size (bytes) | 11,563,781,760 | 3,335,368,320 |
| Size | 10.8 GB | 3.1 GB |
| Events in quadrant A | 71,650,747 | 22,456,540 |
| Events in quadrant B | 111,336,632 | 21,371,277 |
| Events in quadrant C | 44,975,823 | 22,597,130 |
| Events in quadrant D | 108,742,157 | 20,967,106 |
| Mode M9 | |||
|---|---|---|---|
| Quadrant | BADHDUFLAG | Total packets | Discarded packets |
| A | 0 | 307 | 0 |
| B | 0 | 307 | 0 |
| C | 0 | 307 | 0 |
| D | 0 | 307 | 0 |
| Mode M0 | |||
|---|---|---|---|
| Quadrant | BADHDUFLAG | Total packets | Discarded packets |
| A | 0 | 510220 | 0 |
| B | 0 | 646413 | 0 |
| C | 0 | 425802 | 0 |
| D | 0 | 651258 | 0 |
| Mode SS | |||
|---|---|---|---|
| Quadrant | BADHDUFLAG | Total packets | Discarded packets |
| A | 0 | 4058 | 0 |
| B | 0 | 4058 | 0 |
| C | 0 | 4058 | 0 |
| D | 0 | 4060 | 0 |
| Quadrant | Total seconds | Saturated seconds | Saturation percentage |
|---|---|---|---|
| A | 198885 | 3608 | 1.814114% |
| B | 198911 | 33634 | 16.909070% |
| C | 198882 | 3934 | 1.978057% |
| D | 198893 | 22380 | 11.252281% |
Noise dominated data is calculated using 1-second bins in cleaned event files. If a bin has >2000 counts, and if more than 50% of those come from <1% of pixels, then it is considered to be noise-dominated and hence unusable.
| Quadrant | # 1 sec bins | Bins with >0 counts | Bins with >2000 counts | High rate bins dominated by noise | Noise dominated (total time) | Noise dominated (detector-on time) | Marked lightcurve |
|---|---|---|---|---|---|---|---|
| A | 230613 | 198988 | 32 | 32 | 0.01% | 0.02% |  |
| B | 230613 | 199022 | 13125 | 13125 | 5.69% | 6.59% |  |
| C | 230613 | 198981 | 106 | 106 | 0.05% | 0.05% |  |
| D | 230613 | 198979 | 6358 | 6358 | 2.76% | 3.20% |  |
Top three noisy pixels from each quadrant. If the there are fewer than three noisy pixels in the level2.evt file, extra rows are filled as -1
| Pixel properties | Quadrant properties | ||||||
|---|---|---|---|---|---|---|---|
| Quadrant | DetID | PixID | Counts | Sigma | Mean | Median | Sigma |
| A | 0 | 13 | 29640915 | 13001.56 | 10740 | 10594 | 2279.0 |
| A | 13 | 254 | 301369 | 127.59 | 10740 | 10594 | 2279.0 |
| A | 6 | 16 | 185967 | 76.95 | 10740 | 10594 | 2279.0 |
| B | 0 | 189 | 69546562 | 37067.34 | 10051 | 9825 | 1876.0 |
| B | 10 | 246 | 1010347 | 533.34 | 10051 | 9825 | 1876.0 |
| B | 0 | 229 | 805339 | 424.06 | 10051 | 9825 | 1876.0 |
| C | 15 | 208 | 2364401 | 932.59 | 10662 | 10654 | 2523.9 |
| C | 2 | 16 | 964243 | 377.83 | 10662 | 10654 | 2523.9 |
| C | 3 | 233 | 383029 | 147.54 | 10662 | 10654 | 2523.9 |
| D | 1 | 52 | 28565095 | 11851.75 | 10301 | 10047 | 2409.4 |
| D | 7 | 80 | 22615645 | 9382.43 | 10301 | 10047 | 2409.4 |
| D | 15 | 36 | 9678446 | 4012.86 | 10301 | 10047 | 2409.4 |
Histogram calculated using DETX and DETY for each event in the final _common_clean file
| Quadrant A |  |
 |
Quadrant B |
|---|---|---|---|
| Quadrant D |  |
 |
Quadrant C |
| Plot type | Count rate plots | Images |
|---|---|---|
| Comparison with Poisson distribution Blue bars denote a histogram of data divided into 1 sec bins. Red curve is a Poisson curve with rate = median count rate of data. |
 |
 |
| Quadrant-wise count rates Data is divided into 100 sec bins |
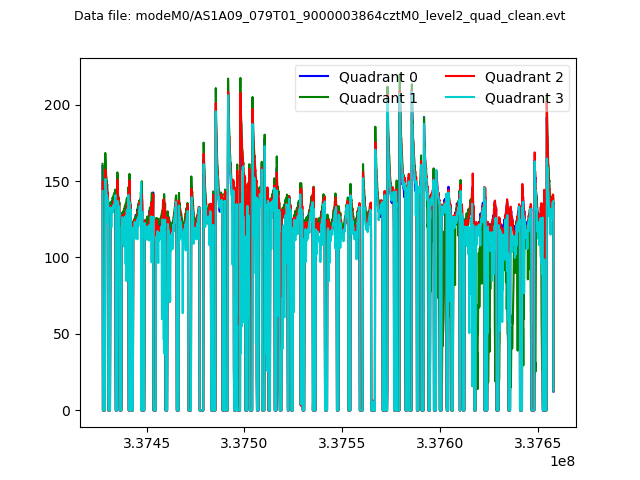 |
|
| Module-wise count rates for Quadrant A Data is divided into 100 sec bins |
 |
 |
| Module-wise count rates for Quadrant B Data is divided into 100 sec bins |
 |
 |
| Module-wise count rates for Quadrant C Data is divided into 100 sec bins |
 |
 |
| Module-wise count rates for Quadrant D Data is divided into 100 sec bins |
 |
 |
| Parameter | Plot |
|---|---|
| CZT HV Monitor |  |
| D_VDD |  |
| Temperature 1 |  |
| Veto HV Monitor |  |
| Veto LLD |  |
| Alpha Counter |  |
| _CPM_Rate | 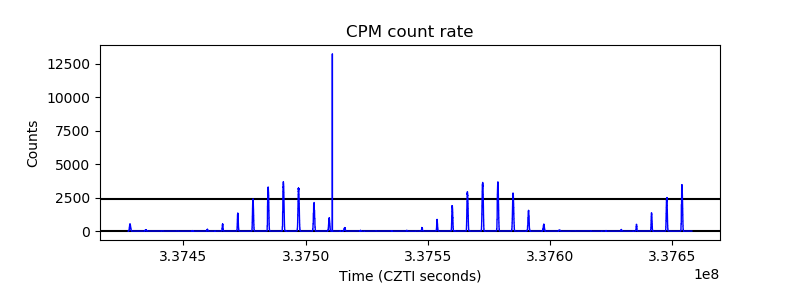 |
| CZT Counter |  |
| +2.5 Volts monitor |  |
| +5 Volts monitor |  |
| _ROLL_ROT | 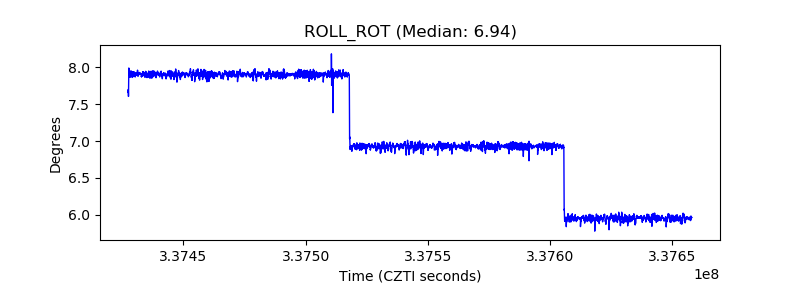 |
| _Roll_DEC |  |
| _Roll_RA |  |
| Veto Counter | 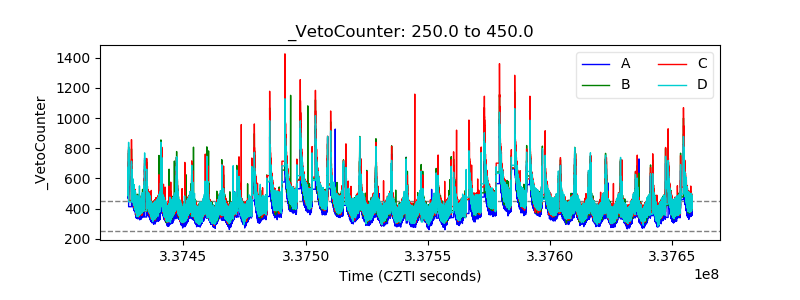 |