| Param | Original file | Final file |
|---|---|---|
| Filename | modeM0/AS1A07_027T01_9000003862cztM0_level2_bc.evt | modeM0/AS1A07_027T01_9000003862cztM0_level2_quad_clean.evt |
| Size (bytes) | 1,917,964,800 | 355,622,400 |
| Size | 1.8 GB | 339.1 MB |
| Events in quadrant A | 9,765,085 | 2,310,101 |
| Events in quadrant B | 18,467,479 | 2,209,032 |
| Events in quadrant C | 7,323,924 | 2,310,091 |
| Events in quadrant D | 20,716,852 | 2,107,817 |
| Mode M0 | |||
|---|---|---|---|
| Quadrant | BADHDUFLAG | Total packets | Discarded packets |
| A | 0 | 69594 | 0 |
| B | 0 | 96826 | 0 |
| C | 0 | 61801 | 0 |
| D | 0 | 111903 | 0 |
| Mode SS | |||
|---|---|---|---|
| Quadrant | BADHDUFLAG | Total packets | Discarded packets |
| A | 0 | 544 | 0 |
| B | 0 | 544 | 0 |
| C | 0 | 544 | 0 |
| D | 0 | 544 | 0 |
| Mode M9 | |||
|---|---|---|---|
| Quadrant | BADHDUFLAG | Total packets | Discarded packets |
| A | 0 | 63 | 0 |
| B | 0 | 63 | 0 |
| C | 0 | 63 | 0 |
| D | 0 | 63 | 0 |
| Quadrant | Total seconds | Saturated seconds | Saturation percentage |
|---|---|---|---|
| A | 26636 | 302 | 1.133804% |
| B | 26636 | 5918 | 22.218051% |
| C | 26636 | 768 | 2.883316% |
| D | 26636 | 4823 | 18.107073% |
Noise dominated data is calculated using 1-second bins in cleaned event files. If a bin has >2000 counts, and if more than 50% of those come from <1% of pixels, then it is considered to be noise-dominated and hence unusable.
| Quadrant | # 1 sec bins | Bins with >0 counts | Bins with >2000 counts | High rate bins dominated by noise | Noise dominated (total time) | Noise dominated (detector-on time) | Marked lightcurve |
|---|---|---|---|---|---|---|---|
| A | 32906 | 26637 | 3 | 3 | 0.01% | 0.01% |  |
| B | 32906 | 26635 | 3115 | 3115 | 9.47% | 11.70% |  |
| C | 32906 | 26637 | 50 | 50 | 0.15% | 0.19% |  |
| D | 32906 | 26636 | 877 | 877 | 2.67% | 3.29% |  |
Top three noisy pixels from each quadrant. If the there are fewer than three noisy pixels in the level2.evt file, extra rows are filled as -1
| Pixel properties | Quadrant properties | ||||||
|---|---|---|---|---|---|---|---|
| Quadrant | DetID | PixID | Counts | Sigma | Mean | Median | Sigma |
| A | 0 | 13 | 3493242 | 10191.94 | 1621 | 1599 | 342.6 |
| A | 13 | 254 | 41590 | 116.73 | 1621 | 1599 | 342.6 |
| A | 12 | 96 | 21849 | 59.11 | 1621 | 1599 | 342.6 |
| B | 0 | 189 | 12603254 | 46000.49 | 1497 | 1472 | 273.9 |
| B | 0 | 190 | 71222 | 254.61 | 1497 | 1472 | 273.9 |
| B | 15 | 32 | 43246 | 152.49 | 1497 | 1472 | 273.9 |
| C | 2 | 16 | 946632 | 2541.48 | 1599 | 1601 | 371.8 |
| C | 15 | 208 | 171924 | 458.05 | 1599 | 1601 | 371.8 |
| C | 10 | 22 | 32579 | 83.31 | 1599 | 1601 | 371.8 |
| D | 7 | 80 | 11002960 | 32191.65 | 1512 | 1480 | 341.7 |
| D | 1 | 52 | 2347822 | 6865.68 | 1512 | 1480 | 341.7 |
| D | 15 | 21 | 631646 | 1843.94 | 1512 | 1480 | 341.7 |
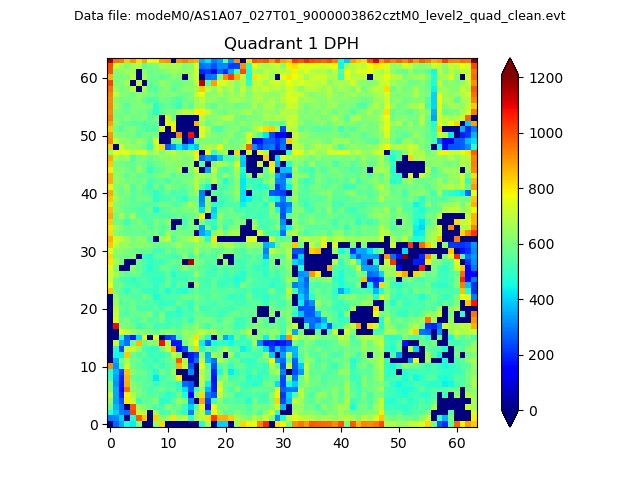
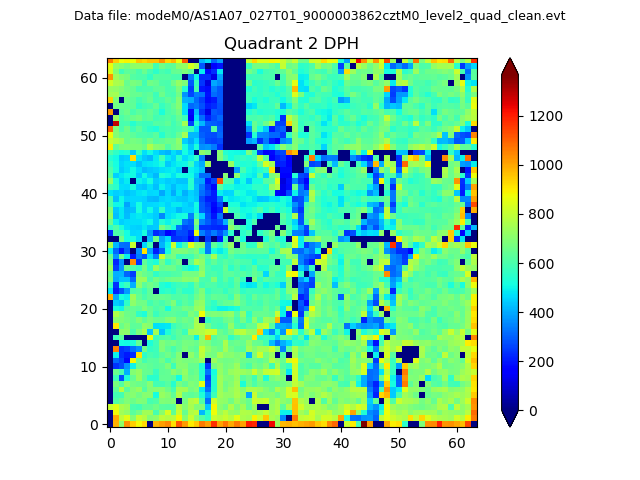
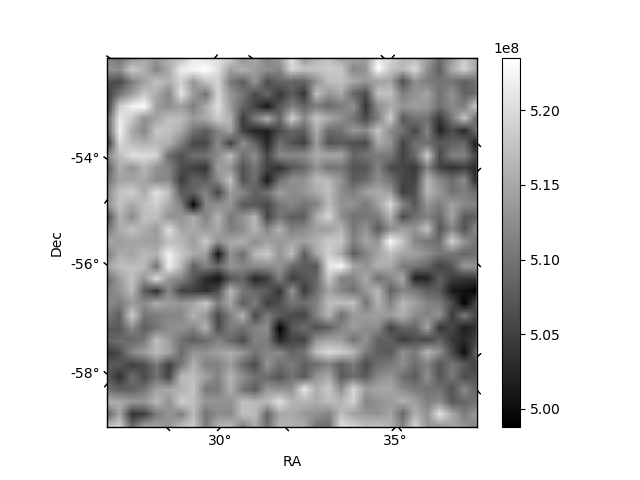
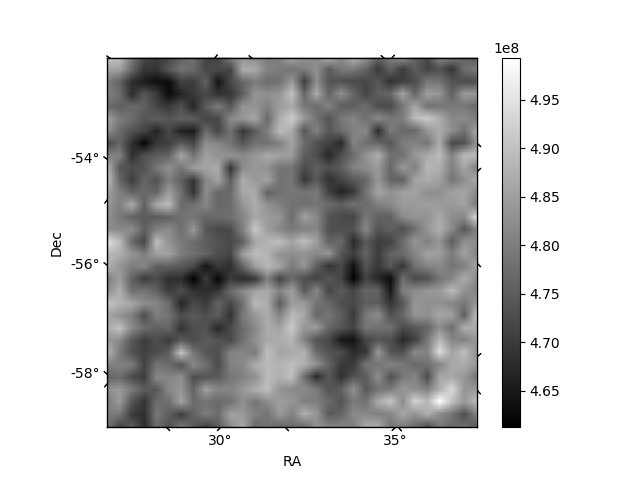
Histogram calculated using DETX and DETY for each event in the final _common_clean file
| Quadrant A |  |
 |
Quadrant B |
|---|---|---|---|
| Quadrant D | 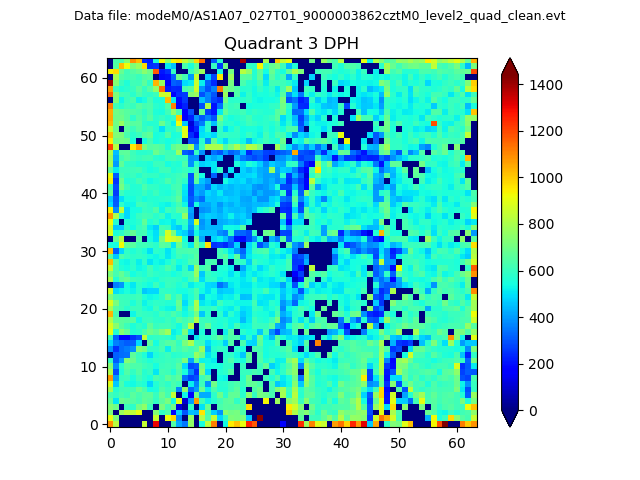 |
 |
Quadrant C |
| Plot type | Count rate plots | Images |
|---|---|---|
| Comparison with Poisson distribution Blue bars denote a histogram of data divided into 1 sec bins. Red curve is a Poisson curve with rate = median count rate of data. |
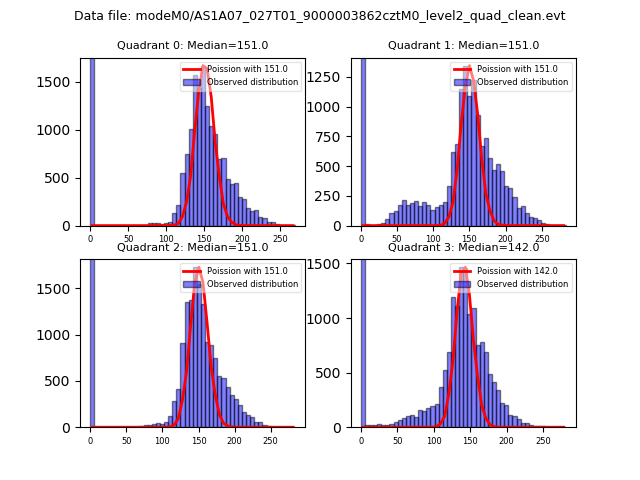 |
 |
| Quadrant-wise count rates Data is divided into 100 sec bins |
 |
|
| Module-wise count rates for Quadrant A Data is divided into 100 sec bins |
 |
 |
| Module-wise count rates for Quadrant B Data is divided into 100 sec bins |
 |
 |
| Module-wise count rates for Quadrant C Data is divided into 100 sec bins |
 |
 |
| Module-wise count rates for Quadrant D Data is divided into 100 sec bins |
 |
 |
| Parameter | Plot |
|---|---|
| CZT HV Monitor | 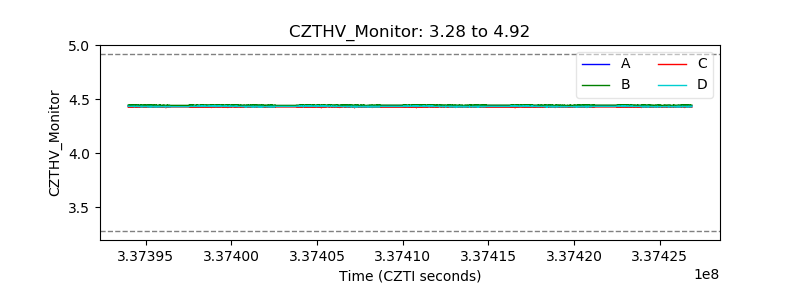 |
| D_VDD |  |
| Temperature 1 |  |
| Veto HV Monitor |  |
| Veto LLD |  |
| Alpha Counter |  |
| _CPM_Rate | 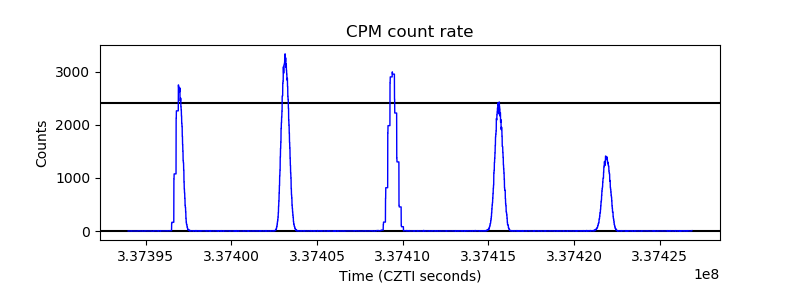 |
| CZT Counter | 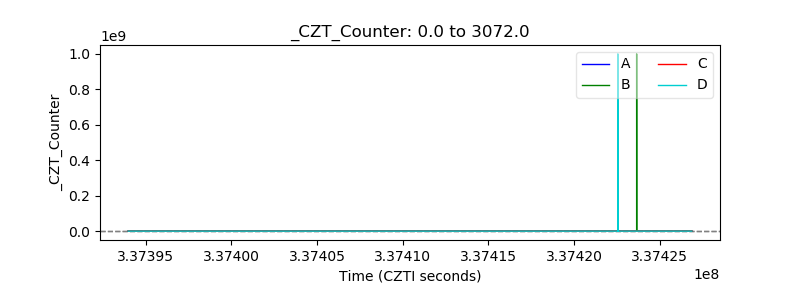 |
| +2.5 Volts monitor |  |
| +5 Volts monitor |  |
| _ROLL_ROT |  |
| _Roll_DEC |  |
| _Roll_RA |  |
| Veto Counter |  |