| Param | Original file | Final file |
|---|---|---|
| Filename | modeM0/AS1A09_038T09_9000003860cztM0_level2_bc.evt | modeM0/AS1A09_038T09_9000003860cztM0_level2_quad_clean.evt |
| Size (bytes) | 1,298,134,080 | 197,386,560 |
| Size | 1.2 GB | 188.2 MB |
| Events in quadrant A | 6,428,496 | 1,423,798 |
| Events in quadrant B | 19,332,704 | 941,783 |
| Events in quadrant C | 2,777,560 | 1,427,774 |
| Events in quadrant D | 9,850,244 | 1,244,648 |
| Mode M0 | |||
|---|---|---|---|
| Quadrant | BADHDUFLAG | Total packets | Discarded packets |
| A | 0 | 40473 | 0 |
| B | 0 | 87693 | 0 |
| C | 0 | 27889 | 0 |
| D | 0 | 56166 | 0 |
| Mode SS | |||
|---|---|---|---|
| Quadrant | BADHDUFLAG | Total packets | Discarded packets |
| A | 0 | 278 | 0 |
| B | 0 | 278 | 0 |
| C | 0 | 278 | 0 |
| D | 0 | 278 | 0 |
| Mode M9 | |||
|---|---|---|---|
| Quadrant | BADHDUFLAG | Total packets | Discarded packets |
| A | 0 | 24 | 0 |
| B | 0 | 24 | 0 |
| C | 0 | 24 | 0 |
| D | 0 | 24 | 0 |
| Quadrant | Total seconds | Saturated seconds | Saturation percentage |
|---|---|---|---|
| A | 13544 | 407 | 3.005021% |
| B | 13544 | 8760 | 64.678086% |
| C | 13544 | 145 | 1.070585% |
| D | 13544 | 2640 | 19.492026% |
Noise dominated data is calculated using 1-second bins in cleaned event files. If a bin has >2000 counts, and if more than 50% of those come from <1% of pixels, then it is considered to be noise-dominated and hence unusable.
| Quadrant | # 1 sec bins | Bins with >0 counts | Bins with >2000 counts | High rate bins dominated by noise | Noise dominated (total time) | Noise dominated (detector-on time) | Marked lightcurve |
|---|---|---|---|---|---|---|---|
| A | 15964 | 13545 | 2 | 2 | 0.01% | 0.01% |  |
| B | 15964 | 13545 | 3660 | 3660 | 22.93% | 27.02% |  |
| C | 15964 | 13544 | 2 | 2 | 0.01% | 0.01% |  |
| D | 15964 | 13541 | 350 | 350 | 2.19% | 2.58% |  |
Top three noisy pixels from each quadrant. If the there are fewer than three noisy pixels in the level2.evt file, extra rows are filled as -1
| Pixel properties | Quadrant properties | ||||||
|---|---|---|---|---|---|---|---|
| Quadrant | DetID | PixID | Counts | Sigma | Mean | Median | Sigma |
| A | 0 | 13 | 3730296 | 24661.1 | 688 | 675 | 151.2 |
| A | 13 | 254 | 22664 | 145.4 | 688 | 675 | 151.2 |
| A | 6 | 16 | 17882 | 113.78 | 688 | 675 | 151.2 |
| B | 0 | 189 | 17466402 | 188097.89 | 473 | 464 | 92.9 |
| B | 3 | 112 | 24780 | 261.87 | 473 | 464 | 92.9 |
| B | 10 | 246 | 13907 | 144.77 | 473 | 464 | 92.9 |
| C | 2 | 16 | 90621 | 544.75 | 680 | 676 | 165.1 |
| C | 15 | 208 | 65644 | 393.48 | 680 | 676 | 165.1 |
| C | 3 | 233 | 8498 | 47.37 | 680 | 676 | 165.1 |
| D | 7 | 80 | 6343700 | 43219.41 | 624 | 607 | 146.8 |
| D | 1 | 52 | 711724 | 4845.28 | 624 | 607 | 146.8 |
| D | 2 | 250 | 211958 | 1440.06 | 624 | 607 | 146.8 |
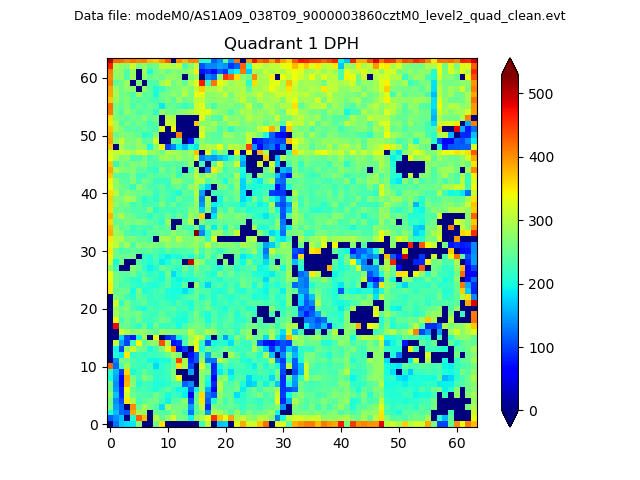
Histogram calculated using DETX and DETY for each event in the final _common_clean file
| Quadrant A |  |
 |
Quadrant B |
|---|---|---|---|
| Quadrant D |  |
 |
Quadrant C |
| Plot type | Count rate plots | Images |
|---|---|---|
| Comparison with Poisson distribution Blue bars denote a histogram of data divided into 1 sec bins. Red curve is a Poisson curve with rate = median count rate of data. |
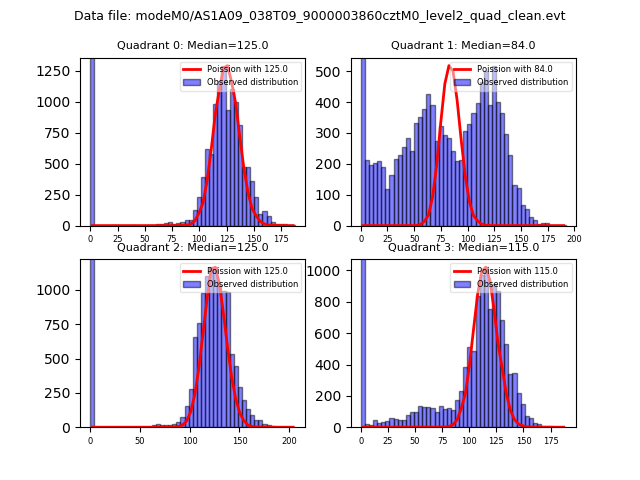 |
 |
| Quadrant-wise count rates Data is divided into 100 sec bins |
 |
|
| Module-wise count rates for Quadrant A Data is divided into 100 sec bins |
 |
 |
| Module-wise count rates for Quadrant B Data is divided into 100 sec bins |
 |
 |
| Module-wise count rates for Quadrant C Data is divided into 100 sec bins |
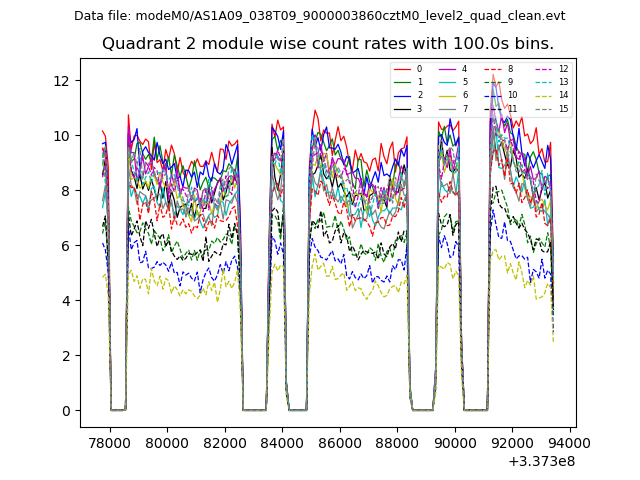 |
 |
| Module-wise count rates for Quadrant D Data is divided into 100 sec bins |
 |
 |
| Parameter | Plot |
|---|---|
| CZT HV Monitor |  |
| D_VDD |  |
| Temperature 1 |  |
| Veto HV Monitor |  |
| Veto LLD |  |
| Alpha Counter |  |
| _CPM_Rate | 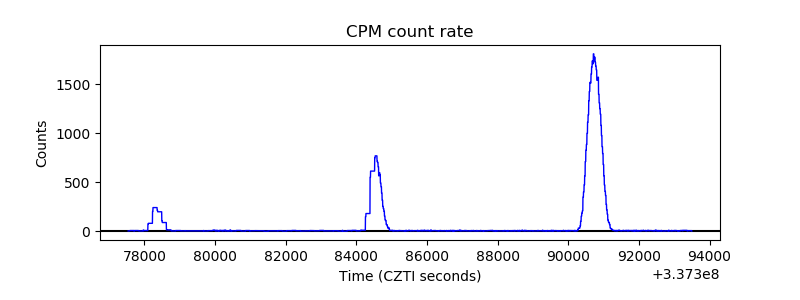 |
| CZT Counter |  |
| +2.5 Volts monitor |  |
| +5 Volts monitor |  |
| _ROLL_ROT |  |
| _Roll_DEC |  |
| _Roll_RA |  |
| Veto Counter |  |