| Param | Original file | Final file |
|---|---|---|
| Filename | modeM0/AS1A09_038T07_9000003858cztM0_level2_bc.evt | modeM0/AS1A09_038T07_9000003858cztM0_level2_quad_clean.evt |
| Size (bytes) | 565,384,320 | 75,948,480 |
| Size | 539.2 MB | 72.4 MB |
| Events in quadrant A | 2,601,192 | 534,933 |
| Events in quadrant B | 7,706,963 | 417,398 |
| Events in quadrant C | 1,125,999 | 531,377 |
| Events in quadrant D | 5,308,715 | 429,898 |
| Mode M0 | |||
|---|---|---|---|
| Quadrant | BADHDUFLAG | Total packets | Discarded packets |
| A | 0 | 16183 | 0 |
| B | 0 | 33025 | 0 |
| C | 0 | 11386 | 0 |
| D | 0 | 28360 | 0 |
| Mode SS | |||
|---|---|---|---|
| Quadrant | BADHDUFLAG | Total packets | Discarded packets |
| A | 0 | 112 | 0 |
| B | 0 | 112 | 0 |
| C | 0 | 112 | 0 |
| D | 0 | 112 | 0 |
| Mode M9 | |||
|---|---|---|---|
| Quadrant | BADHDUFLAG | Total packets | Discarded packets |
| A | 0 | 5 | 0 |
| B | 0 | 5 | 0 |
| C | 0 | 5 | 0 |
| D | 0 | 5 | 0 |
| Quadrant | Total seconds | Saturated seconds | Saturation percentage |
|---|---|---|---|
| A | 5494 | 119 | 2.165999% |
| B | 5494 | 3123 | 56.843830% |
| C | 5494 | 60 | 1.092100% |
| D | 5494 | 2010 | 36.585366% |
Noise dominated data is calculated using 1-second bins in cleaned event files. If a bin has >2000 counts, and if more than 50% of those come from <1% of pixels, then it is considered to be noise-dominated and hence unusable.
| Quadrant | # 1 sec bins | Bins with >0 counts | Bins with >2000 counts | High rate bins dominated by noise | Noise dominated (total time) | Noise dominated (detector-on time) | Marked lightcurve |
|---|---|---|---|---|---|---|---|
| A | 5949 | 5494 | 4 | 4 | 0.07% | 0.07% |  |
| B | 5949 | 5493 | 1327 | 1327 | 22.31% | 24.16% |  |
| C | 5949 | 5494 | 2 | 2 | 0.03% | 0.04% |  |
| D | 5949 | 5493 | 325 | 325 | 5.46% | 5.92% | 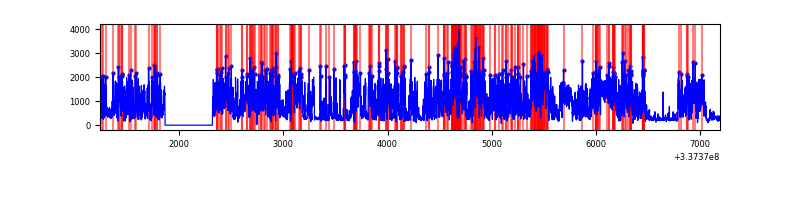 |
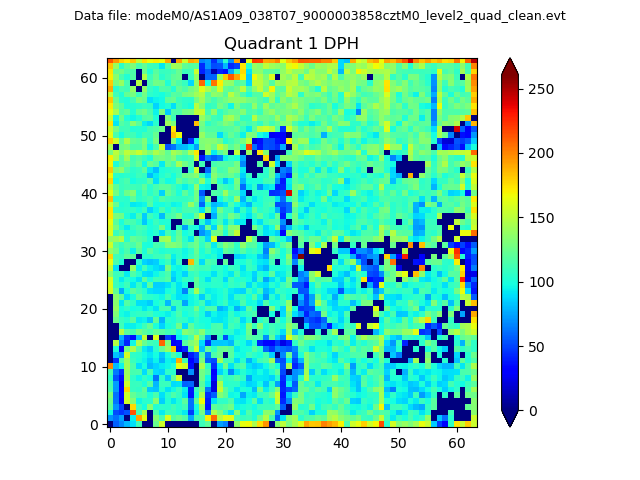
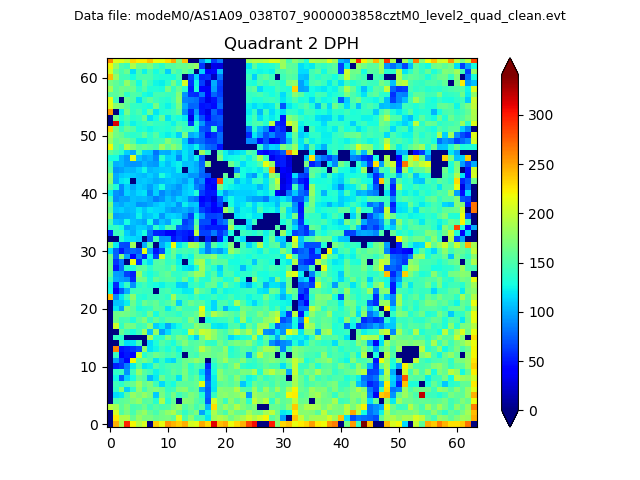
Top three noisy pixels from each quadrant. If the there are fewer than three noisy pixels in the level2.evt file, extra rows are filled as -1
| Pixel properties | Quadrant properties | ||||||
|---|---|---|---|---|---|---|---|
| Quadrant | DetID | PixID | Counts | Sigma | Mean | Median | Sigma |
| A | 0 | 13 | 1519706 | 24399.02 | 275 | 269 | 62.3 |
| A | 6 | 16 | 10203 | 159.52 | 275 | 269 | 62.3 |
| A | 13 | 254 | 9371 | 146.16 | 275 | 269 | 62.3 |
| B | 0 | 189 | 6889555 | 158121.09 | 210 | 205 | 43.6 |
| B | 0 | 228 | 3777 | 81.98 | 210 | 205 | 43.6 |
| B | 0 | 229 | 3263 | 70.19 | 210 | 205 | 43.6 |
| C | 2 | 16 | 49213 | 746.0 | 269 | 268 | 65.6 |
| C | 1 | 0 | 18816 | 282.7 | 269 | 268 | 65.6 |
| C | 8 | 128 | 9343 | 138.32 | 269 | 268 | 65.6 |
| D | 7 | 80 | 4042651 | 71586.16 | 230 | 223 | 56.5 |
| D | 1 | 52 | 246037 | 4353.05 | 230 | 223 | 56.5 |
| D | 2 | 250 | 71995 | 1270.99 | 230 | 223 | 56.5 |
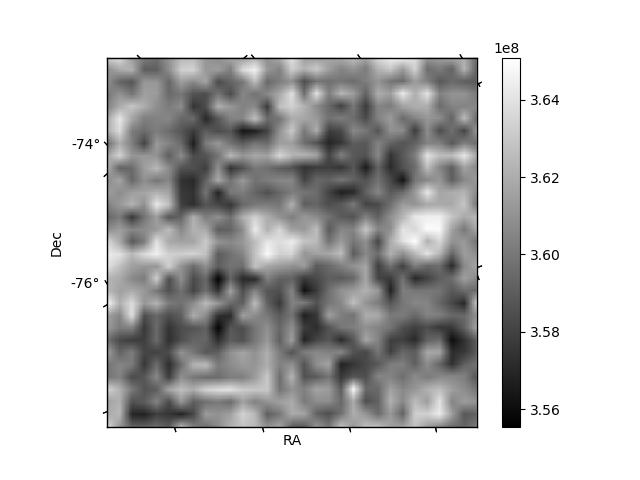
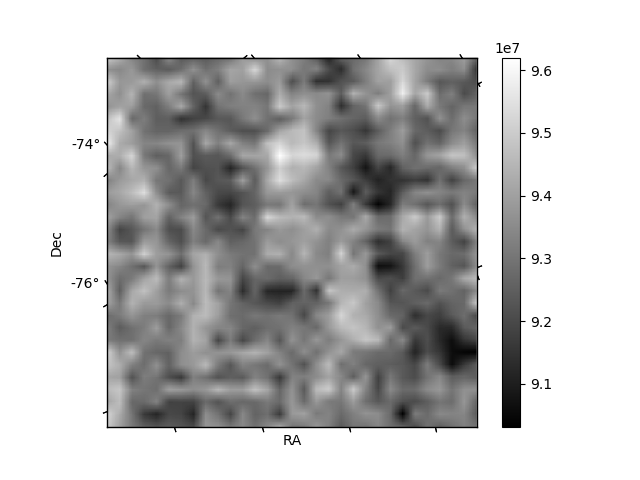
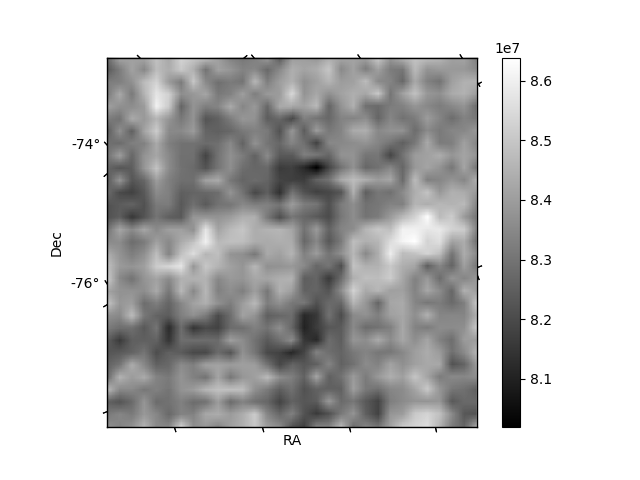
Histogram calculated using DETX and DETY for each event in the final _common_clean file
| Quadrant A |  |
 |
Quadrant B |
|---|---|---|---|
| Quadrant D | 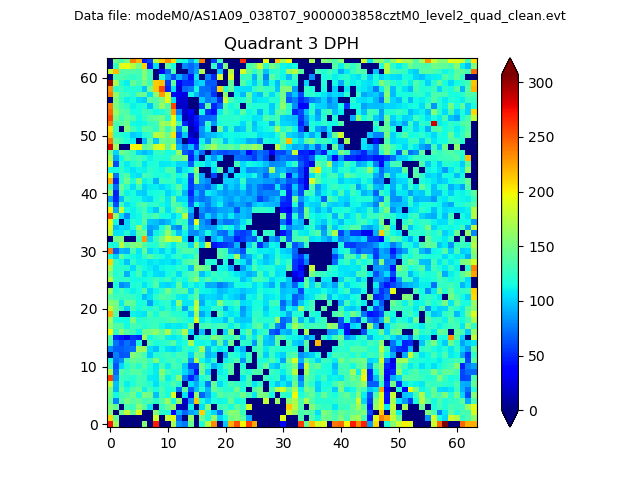 |
 |
Quadrant C |
| Plot type | Count rate plots | Images |
|---|---|---|
| Comparison with Poisson distribution Blue bars denote a histogram of data divided into 1 sec bins. Red curve is a Poisson curve with rate = median count rate of data. |
 |
 |
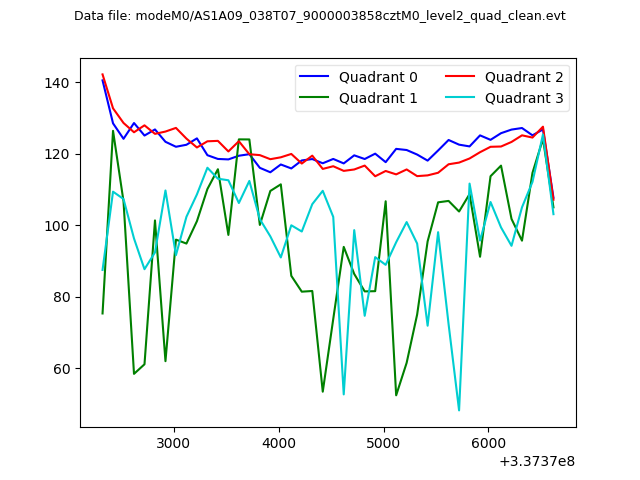
| Quadrant-wise count rates Data is divided into 100 sec bins |
 |
|
| Module-wise count rates for Quadrant A Data is divided into 100 sec bins |
 |
 |
| Module-wise count rates for Quadrant B Data is divided into 100 sec bins |
 |
 |
| Module-wise count rates for Quadrant C Data is divided into 100 sec bins |
 |
 |
| Module-wise count rates for Quadrant D Data is divided into 100 sec bins |
 |
 |
| Parameter | Plot |
|---|---|
| CZT HV Monitor |  |
| D_VDD |  |
| Temperature 1 |  |
| Veto HV Monitor |  |
| Veto LLD |  |
| Alpha Counter |  |
| _CPM_Rate |  |
| CZT Counter |  |
| +2.5 Volts monitor |  |
| +5 Volts monitor |  |
| _ROLL_ROT |  |
| _Roll_DEC |  |
| _Roll_RA |  |
| Veto Counter | 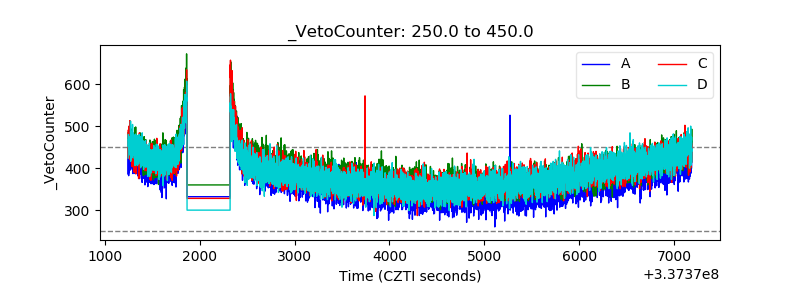 |