| Param | Original file | Final file |
|---|---|---|
| Filename | modeM0/AS1A09_044T02_9000003852cztM0_level2_bc.evt | modeM0/AS1A09_044T02_9000003852cztM0_level2_quad_clean.evt |
| Size (bytes) | 2,918,442,240 | 432,273,600 |
| Size | 2.7 GB | 412.2 MB |
| Events in quadrant A | 11,968,156 | 2,994,492 |
| Events in quadrant B | 30,121,232 | 2,103,731 |
| Events in quadrant C | 9,461,302 | 2,868,076 |
| Events in quadrant D | 34,134,133 | 2,392,584 |
| Mode SS | |||
|---|---|---|---|
| Quadrant | BADHDUFLAG | Total packets | Discarded packets |
| A | 0 | 812 | 0 |
| B | 0 | 812 | 0 |
| C | 0 | 812 | 0 |
| D | 0 | 812 | 0 |
| Mode M9 | |||
|---|---|---|---|
| Quadrant | BADHDUFLAG | Total packets | Discarded packets |
| A | 0 | 89 | 0 |
| B | 0 | 89 | 0 |
| C | 0 | 89 | 0 |
| D | 0 | 89 | 0 |
| Mode M0 | |||
|---|---|---|---|
| Quadrant | BADHDUFLAG | Total packets | Discarded packets |
| A | 0 | 95767 | 0 |
| B | 0 | 166049 | 0 |
| C | 0 | 87755 | 0 |
| D | 0 | 183971 | 0 |
| Quadrant | Total seconds | Saturated seconds | Saturation percentage |
|---|---|---|---|
| A | 39696 | 445 | 1.121020% |
| B | 39696 | 11547 | 29.088573% |
| C | 39696 | 742 | 1.869206% |
| D | 39696 | 10841 | 27.310056% |
Noise dominated data is calculated using 1-second bins in cleaned event files. If a bin has >2000 counts, and if more than 50% of those come from <1% of pixels, then it is considered to be noise-dominated and hence unusable.
| Quadrant | # 1 sec bins | Bins with >0 counts | Bins with >2000 counts | High rate bins dominated by noise | Noise dominated (total time) | Noise dominated (detector-on time) | Marked lightcurve |
|---|---|---|---|---|---|---|---|
| A | 48701 | 39695 | 2 | 2 | 0.00% | 0.01% |  |
| B | 48701 | 39692 | 4004 | 4004 | 8.22% | 10.09% |  |
| C | 48701 | 39697 | 19 | 19 | 0.04% | 0.05% | 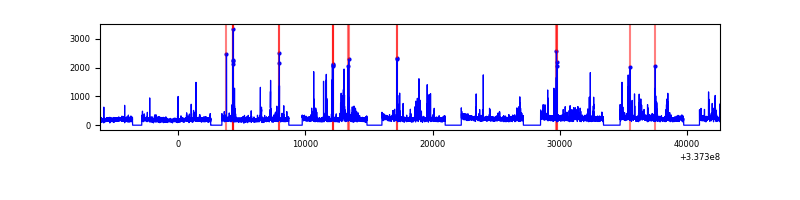 |
| D | 48701 | 39694 | 2255 | 2255 | 4.63% | 5.68% |  |
Top three noisy pixels from each quadrant. If the there are fewer than three noisy pixels in the level2.evt file, extra rows are filled as -1
| Pixel properties | Quadrant properties | ||||||
|---|---|---|---|---|---|---|---|
| Quadrant | DetID | PixID | Counts | Sigma | Mean | Median | Sigma |
| A | 0 | 13 | 2709843 | 5385.54 | 2375 | 2345 | 502.7 |
| A | 13 | 254 | 60227 | 115.13 | 2375 | 2345 | 502.7 |
| A | 6 | 16 | 38731 | 72.38 | 2375 | 2345 | 502.7 |
| B | 0 | 189 | 22078112 | 58906.97 | 2020 | 1977 | 374.8 |
| B | 10 | 246 | 148321 | 390.5 | 2020 | 1977 | 374.8 |
| B | 3 | 112 | 71366 | 185.15 | 2020 | 1977 | 374.8 |
| C | 2 | 16 | 565317 | 1089.68 | 2245 | 2246 | 516.7 |
| C | 10 | 22 | 145523 | 277.28 | 2245 | 2246 | 516.7 |
| C | 15 | 208 | 115924 | 220.0 | 2245 | 2246 | 516.7 |
| D | 7 | 80 | 22591010 | 46697.48 | 2009 | 1957 | 483.7 |
| D | 1 | 52 | 2167036 | 4475.78 | 2009 | 1957 | 483.7 |
| D | 2 | 250 | 394606 | 811.71 | 2009 | 1957 | 483.7 |
Histogram calculated using DETX and DETY for each event in the final _common_clean file
| Quadrant A |  |
 |
Quadrant B |
|---|---|---|---|
| Quadrant D | 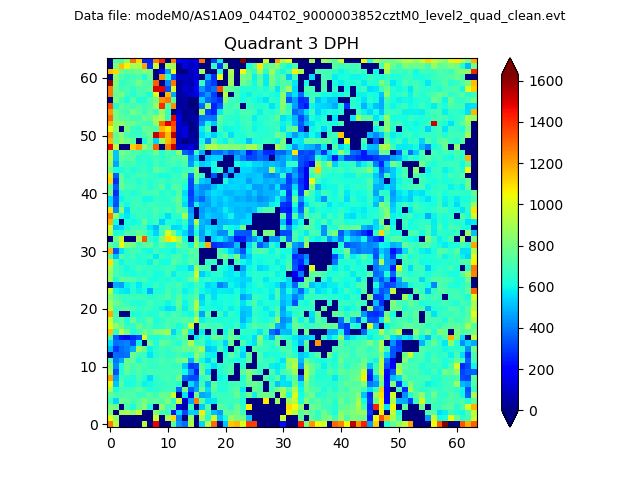 |
 |
Quadrant C |
| Plot type | Count rate plots | Images |
|---|---|---|
| Comparison with Poisson distribution Blue bars denote a histogram of data divided into 1 sec bins. Red curve is a Poisson curve with rate = median count rate of data. |
 |
 |
| Quadrant-wise count rates Data is divided into 100 sec bins |
 |
|
| Module-wise count rates for Quadrant A Data is divided into 100 sec bins |
 |
 |
| Module-wise count rates for Quadrant B Data is divided into 100 sec bins |
 |
 |
| Module-wise count rates for Quadrant C Data is divided into 100 sec bins |
 |
 |
| Module-wise count rates for Quadrant D Data is divided into 100 sec bins |
 |
 |
| Parameter | Plot |
|---|---|
| CZT HV Monitor |  |
| D_VDD |  |
| Temperature 1 |  |
| Veto HV Monitor | 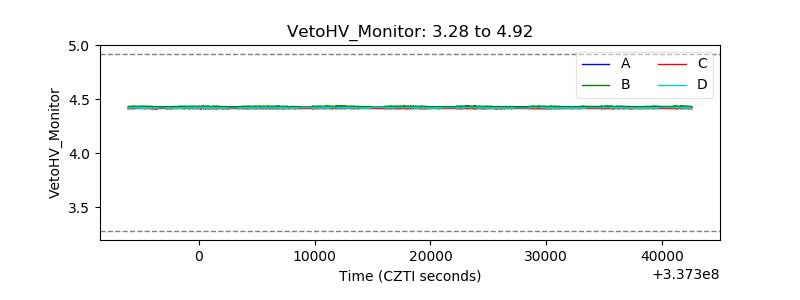 |
| Veto LLD |  |
| Alpha Counter |  |
| _CPM_Rate |  |
| CZT Counter |  |
| +2.5 Volts monitor | 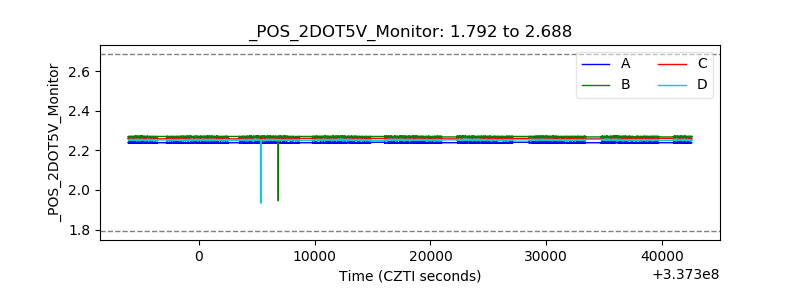 |
| +5 Volts monitor |  |
| _ROLL_ROT |  |
| _Roll_DEC |  |
| _Roll_RA | 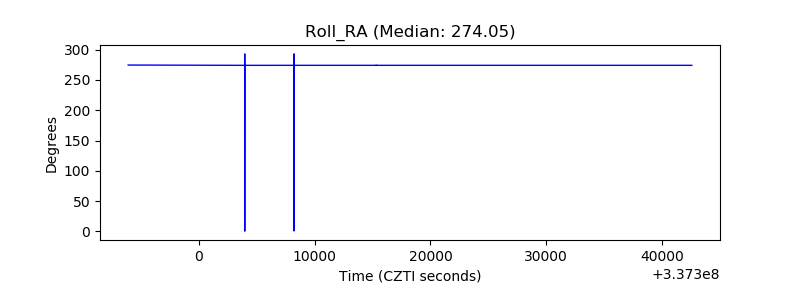 |
| Veto Counter |  |