| Param | Original file | Final file |
|---|---|---|
| Filename | modeM0/AS1A09_095T02_9000003846cztM0_level2_bc.evt | modeM0/AS1A09_095T02_9000003846cztM0_level2_quad_clean.evt |
| Size (bytes) | 12,242,306,880 | 3,235,345,920 |
| Size | 11.4 GB | 3.0 GB |
| Events in quadrant A | 47,364,629 | 22,367,989 |
| Events in quadrant B | 72,201,514 | 22,339,952 |
| Events in quadrant C | 60,088,262 | 21,446,946 |
| Events in quadrant D | 177,305,915 | 17,911,528 |
| Mode M9 | |||
|---|---|---|---|
| Quadrant | BADHDUFLAG | Total packets | Discarded packets |
| A | 0 | 351 | 0 |
| B | 0 | 351 | 0 |
| C | 0 | 351 | 0 |
| D | 0 | 351 | 0 |
| Mode M0 | |||
|---|---|---|---|
| Quadrant | BADHDUFLAG | Total packets | Discarded packets |
| A | 0 | 431057 | 0 |
| B | 0 | 523440 | 0 |
| C | 0 | 494754 | 0 |
| D | 0 | 938776 | 0 |
| Mode SS | |||
|---|---|---|---|
| Quadrant | BADHDUFLAG | Total packets | Discarded packets |
| A | 0 | 4138 | 0 |
| B | 0 | 4138 | 0 |
| C | 0 | 4138 | 0 |
| D | 0 | 4138 | 0 |
| Quadrant | Total seconds | Saturated seconds | Saturation percentage |
|---|---|---|---|
| A | 203171 | 2070 | 1.018846% |
| B | 203171 | 7819 | 3.848482% |
| C | 203171 | 8039 | 3.956765% |
| D | 203171 | 60483 | 29.769505% |
Noise dominated data is calculated using 1-second bins in cleaned event files. If a bin has >2000 counts, and if more than 50% of those come from <1% of pixels, then it is considered to be noise-dominated and hence unusable.
| Quadrant | # 1 sec bins | Bins with >0 counts | Bins with >2000 counts | High rate bins dominated by noise | Noise dominated (total time) | Noise dominated (detector-on time) | Marked lightcurve |
|---|---|---|---|---|---|---|---|
| A | 238230 | 203144 | 74 | 74 | 0.03% | 0.04% | 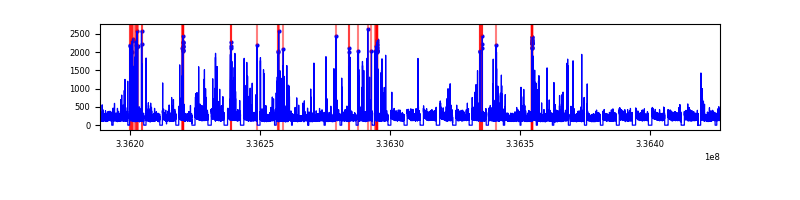 |
| B | 238230 | 203149 | 544 | 544 | 0.23% | 0.27% | 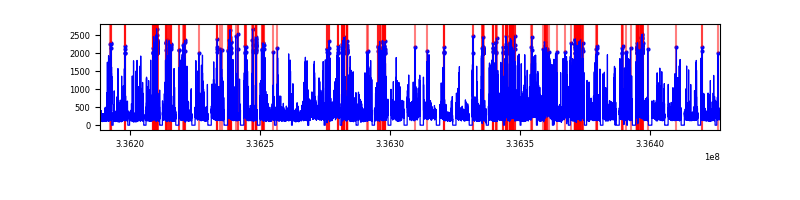 |
| C | 238230 | 203147 | 134 | 134 | 0.06% | 0.07% |  |
| D | 238230 | 203082 | 18559 | 18559 | 7.79% | 9.14% |  |
Top three noisy pixels from each quadrant. If the there are fewer than three noisy pixels in the level2.evt file, extra rows are filled as -1
| Pixel properties | Quadrant properties | ||||||
|---|---|---|---|---|---|---|---|
| Quadrant | DetID | PixID | Counts | Sigma | Mean | Median | Sigma |
| A | 0 | 13 | 1729800 | 705.18 | 11387 | 11254 | 2437.0 |
| A | 12 | 96 | 808186 | 327.01 | 11387 | 11254 | 2437.0 |
| A | 5 | 168 | 465564 | 186.42 | 11387 | 11254 | 2437.0 |
| B | 3 | 64 | 14615145 | 6928.0 | 11290 | 11073 | 2108.0 |
| B | 0 | 189 | 10448090 | 4951.2 | 11290 | 11073 | 2108.0 |
| B | 3 | 112 | 1406189 | 661.83 | 11290 | 11073 | 2108.0 |
| C | 4 | 254 | 9214349 | 3589.39 | 10824 | 10834 | 2564.1 |
| C | 3 | 233 | 6299199 | 2452.48 | 10824 | 10834 | 2564.1 |
| C | 15 | 208 | 2292616 | 889.9 | 10824 | 10834 | 2564.1 |
| D | 1 | 52 | 69521867 | 29171.08 | 9428 | 9195 | 2382.9 |
| D | 7 | 80 | 60624572 | 25437.32 | 9428 | 9195 | 2382.9 |
| D | 2 | 250 | 6552701 | 2745.99 | 9428 | 9195 | 2382.9 |
Histogram calculated using DETX and DETY for each event in the final _common_clean file
| Quadrant A | 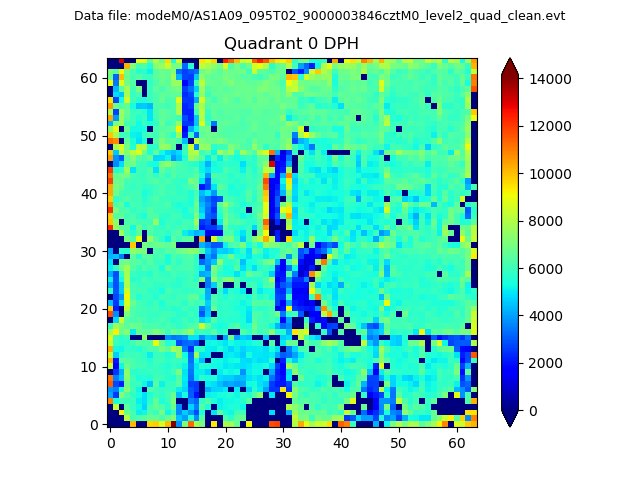 |
 |
Quadrant B |
|---|---|---|---|
| Quadrant D |  |
 |
Quadrant C |
| Plot type | Count rate plots | Images |
|---|---|---|
| Comparison with Poisson distribution Blue bars denote a histogram of data divided into 1 sec bins. Red curve is a Poisson curve with rate = median count rate of data. |
 |
 |
| Quadrant-wise count rates Data is divided into 100 sec bins |
 |
|
| Module-wise count rates for Quadrant A Data is divided into 100 sec bins |
 |
 |
| Module-wise count rates for Quadrant B Data is divided into 100 sec bins |
 |
 |
| Module-wise count rates for Quadrant C Data is divided into 100 sec bins |
 |
 |
| Module-wise count rates for Quadrant D Data is divided into 100 sec bins |
 |
 |
| Parameter | Plot |
|---|---|
| CZT HV Monitor |  |
| D_VDD |  |
| Temperature 1 |  |
| Veto HV Monitor |  |
| Veto LLD |  |
| Alpha Counter |  |
| _CPM_Rate | 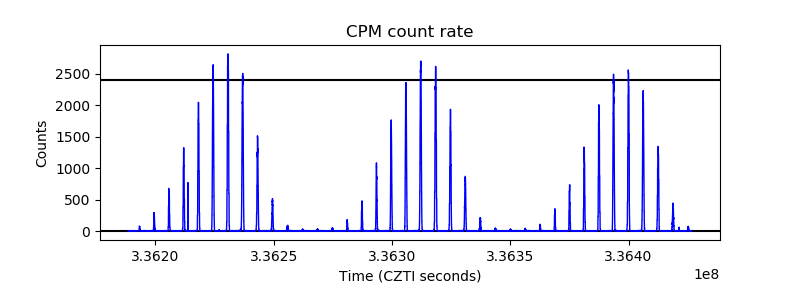 |
| CZT Counter |  |
| +2.5 Volts monitor |  |
| +5 Volts monitor |  |
| _ROLL_ROT |  |
| _Roll_DEC |  |
| _Roll_RA |  |
| Veto Counter |  |