| Param | Original file | Final file |
|---|---|---|
| Filename | modeM0/AS1T03_220T01_9000003842cztM0_level2_bc.evt | modeM0/AS1T03_220T01_9000003842cztM0_level2_quad_clean.evt |
| Size (bytes) | 2,946,957,120 | 803,635,200 |
| Size | 2.7 GB | 766.4 MB |
| Events in quadrant A | 12,814,233 | 5,387,311 |
| Events in quadrant B | 15,945,305 | 5,420,110 |
| Events in quadrant C | 18,837,272 | 5,152,926 |
| Events in quadrant D | 38,009,906 | 4,706,830 |
| Mode SS | |||
|---|---|---|---|
| Quadrant | BADHDUFLAG | Total packets | Discarded packets |
| A | 0 | 1092 | 0 |
| B | 0 | 1092 | 0 |
| C | 0 | 1092 | 0 |
| D | 0 | 1092 | 0 |
| Mode M0 | |||
|---|---|---|---|
| Quadrant | BADHDUFLAG | Total packets | Discarded packets |
| A | 0 | 114284 | 0 |
| B | 0 | 126611 | 0 |
| C | 0 | 145766 | 0 |
| D | 0 | 217298 | 0 |
| Mode M9 | |||
|---|---|---|---|
| Quadrant | BADHDUFLAG | Total packets | Discarded packets |
| A | 0 | 105 | 0 |
| B | 0 | 105 | 0 |
| C | 0 | 105 | 0 |
| D | 0 | 105 | 0 |
| Quadrant | Total seconds | Saturated seconds | Saturation percentage |
|---|---|---|---|
| A | 53496 | 635 | 1.187005% |
| B | 53496 | 1531 | 2.861896% |
| C | 53496 | 4528 | 8.464184% |
| D | 53496 | 11241 | 21.012786% |
Noise dominated data is calculated using 1-second bins in cleaned event files. If a bin has >2000 counts, and if more than 50% of those come from <1% of pixels, then it is considered to be noise-dominated and hence unusable.
| Quadrant | # 1 sec bins | Bins with >0 counts | Bins with >2000 counts | High rate bins dominated by noise | Noise dominated (total time) | Noise dominated (detector-on time) | Marked lightcurve |
|---|---|---|---|---|---|---|---|
| A | 64056 | 53487 | 21 | 21 | 0.03% | 0.04% | 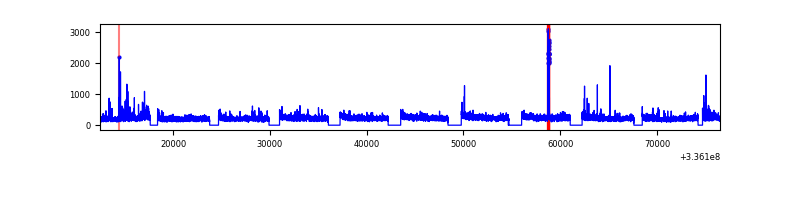 |
| B | 64056 | 53486 | 127 | 127 | 0.20% | 0.24% |  |
| C | 64056 | 53487 | 84 | 84 | 0.13% | 0.16% |  |
| D | 64056 | 53488 | 2462 | 2462 | 3.84% | 4.60% |  |
Top three noisy pixels from each quadrant. If the there are fewer than three noisy pixels in the level2.evt file, extra rows are filled as -1
| Pixel properties | Quadrant properties | ||||||
|---|---|---|---|---|---|---|---|
| Quadrant | DetID | PixID | Counts | Sigma | Mean | Median | Sigma |
| A | 5 | 168 | 426480 | 638.02 | 3077 | 3033 | 663.7 |
| A | 0 | 13 | 342845 | 512.01 | 3077 | 3033 | 663.7 |
| A | 9 | 130 | 141994 | 209.38 | 3077 | 3033 | 663.7 |
| B | 5 | 172 | 1652860 | 2885.49 | 3072 | 3015 | 571.8 |
| B | 3 | 64 | 1209468 | 2110.02 | 3072 | 3015 | 571.8 |
| B | 0 | 189 | 605594 | 1053.88 | 3072 | 3015 | 571.8 |
| C | 4 | 254 | 5970696 | 8842.95 | 2872 | 2869 | 674.9 |
| C | 3 | 233 | 1724523 | 2551.09 | 2872 | 2869 | 674.9 |
| C | 2 | 16 | 51913 | 72.67 | 2872 | 2869 | 674.9 |
| D | 7 | 80 | 18287740 | 27720.57 | 2729 | 2667 | 659.6 |
| D | 1 | 52 | 5835647 | 8842.92 | 2729 | 2667 | 659.6 |
| D | 12 | 233 | 1544662 | 2337.7 | 2729 | 2667 | 659.6 |
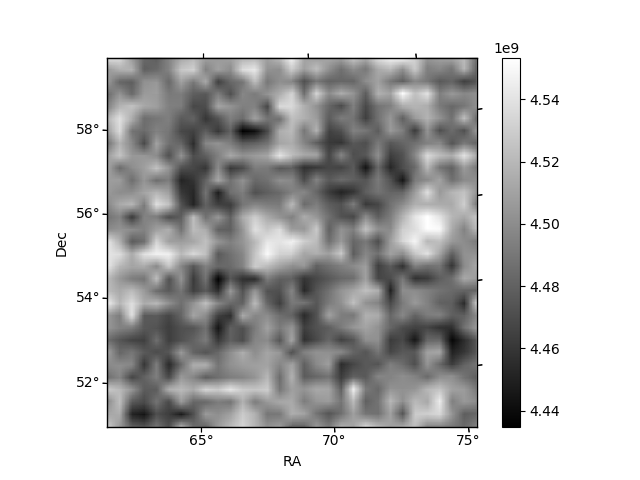
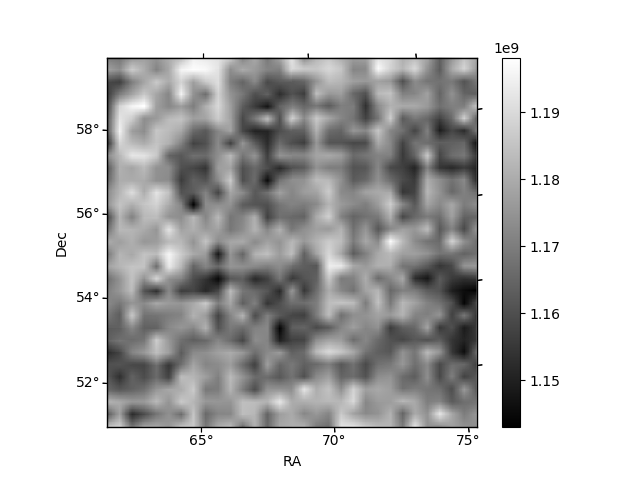
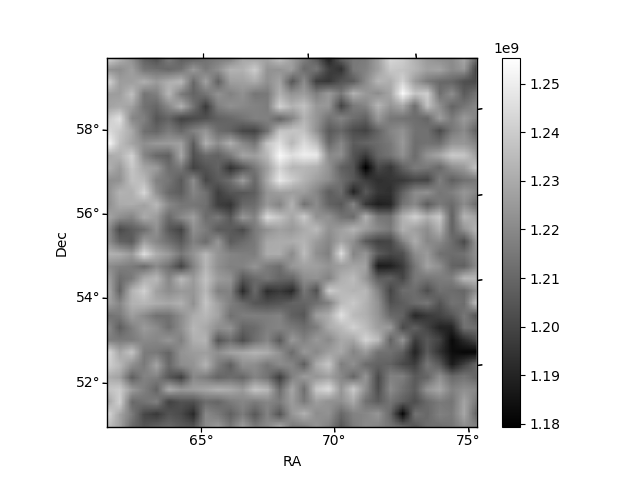
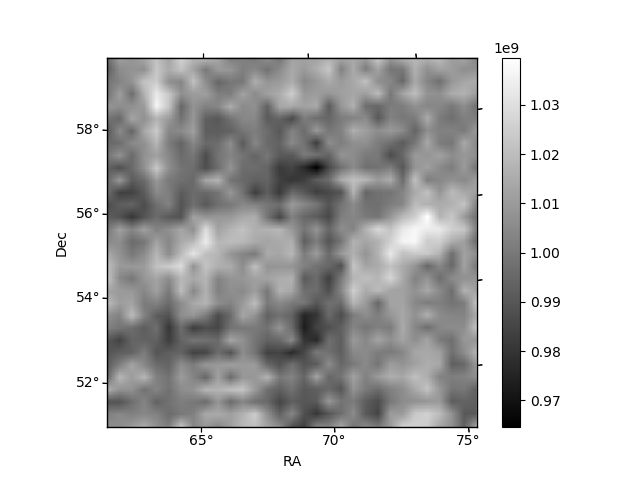
Histogram calculated using DETX and DETY for each event in the final _common_clean file
| Quadrant A |  |
 |
Quadrant B |
|---|---|---|---|
| Quadrant D |  |
 |
Quadrant C |
| Plot type | Count rate plots | Images |
|---|---|---|
| Comparison with Poisson distribution Blue bars denote a histogram of data divided into 1 sec bins. Red curve is a Poisson curve with rate = median count rate of data. |
 |
 |
| Quadrant-wise count rates Data is divided into 100 sec bins |
 |
|
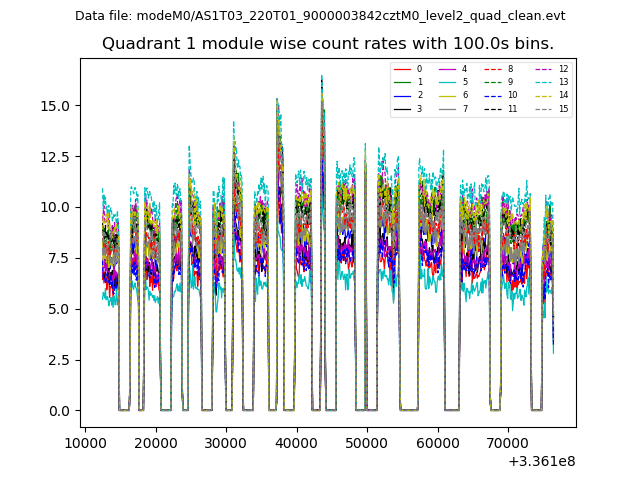
| Module-wise count rates for Quadrant A Data is divided into 100 sec bins |
 |
 |
| Module-wise count rates for Quadrant B Data is divided into 100 sec bins |
 |
 |
| Module-wise count rates for Quadrant C Data is divided into 100 sec bins |
 |
 |
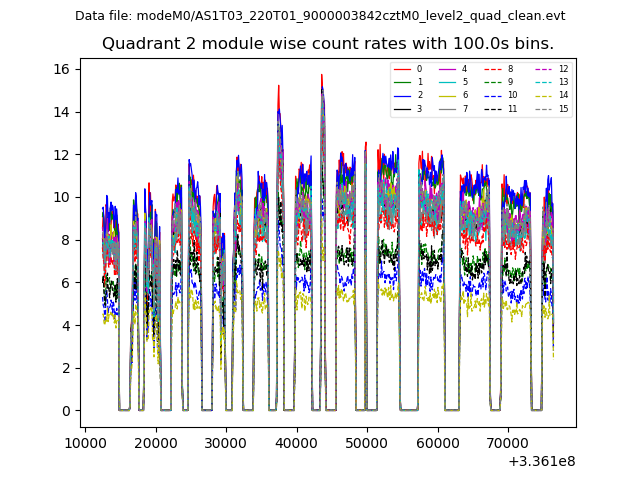
| Module-wise count rates for Quadrant D Data is divided into 100 sec bins |
 |
 |
| Parameter | Plot |
|---|---|
| CZT HV Monitor |  |
| D_VDD |  |
| Temperature 1 |  |
| Veto HV Monitor |  |
| Veto LLD |  |
| Alpha Counter | 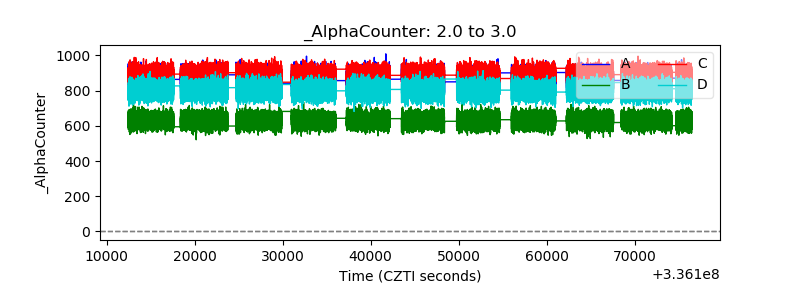 |
| _CPM_Rate |  |
| CZT Counter |  |
| +2.5 Volts monitor |  |
| +5 Volts monitor |  |
| _ROLL_ROT |  |
| _Roll_DEC |  |
| _Roll_RA |  |
| Veto Counter |  |