| Param | Original file | Final file |
|---|---|---|
| Filename | modeM0/AS1A09_038T10_9000003844cztM0_level2_bc.evt | modeM0/AS1A09_038T10_9000003844cztM0_level2_quad_clean.evt |
| Size (bytes) | 576,959,040 | 174,323,520 |
| Size | 550.2 MB | 166.2 MB |
| Events in quadrant A | 2,186,506 | 1,243,673 |
| Events in quadrant B | 2,762,195 | 1,243,358 |
| Events in quadrant C | 3,013,940 | 1,213,787 |
| Events in quadrant D | 8,847,420 | 909,743 |
| Mode SS | |||
|---|---|---|---|
| Quadrant | BADHDUFLAG | Total packets | Discarded packets |
| A | 0 | 196 | 0 |
| B | 0 | 196 | 0 |
| C | 0 | 196 | 0 |
| D | 0 | 196 | 0 |
| Mode M0 | |||
|---|---|---|---|
| Quadrant | BADHDUFLAG | Total packets | Discarded packets |
| A | 0 | 20093 | 0 |
| B | 0 | 22593 | 0 |
| C | 0 | 24022 | 0 |
| D | 0 | 50822 | 0 |
| Mode M9 | |||
|---|---|---|---|
| Quadrant | BADHDUFLAG | Total packets | Discarded packets |
| A | 0 | 6 | 0 |
| B | 0 | 6 | 0 |
| C | 0 | 6 | 0 |
| D | 0 | 6 | 0 |
| Quadrant | Total seconds | Saturated seconds | Saturation percentage |
|---|---|---|---|
| A | 9633 | 51 | 0.529430% |
| B | 9633 | 384 | 3.986297% |
| C | 9633 | 417 | 4.328870% |
| D | 9633 | 4007 | 41.596595% |
Noise dominated data is calculated using 1-second bins in cleaned event files. If a bin has >2000 counts, and if more than 50% of those come from <1% of pixels, then it is considered to be noise-dominated and hence unusable.
| Quadrant | # 1 sec bins | Bins with >0 counts | Bins with >2000 counts | High rate bins dominated by noise | Noise dominated (total time) | Noise dominated (detector-on time) | Marked lightcurve |
|---|---|---|---|---|---|---|---|
| A | 10268 | 9633 | 0 | 0 | 0.00% | 0.00% |  |
| B | 10268 | 9634 | 53 | 53 | 0.52% | 0.55% |  |
| C | 10268 | 9633 | 11 | 11 | 0.11% | 0.11% | 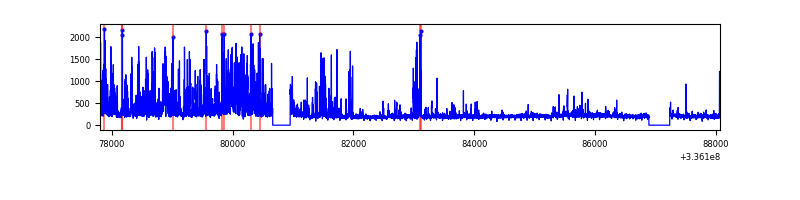 |
| D | 10268 | 9628 | 423 | 423 | 4.12% | 4.39% |  |
Top three noisy pixels from each quadrant. If the there are fewer than three noisy pixels in the level2.evt file, extra rows are filled as -1
| Pixel properties | Quadrant properties | ||||||
|---|---|---|---|---|---|---|---|
| Quadrant | DetID | PixID | Counts | Sigma | Mean | Median | Sigma |
| A | 0 | 13 | 111406 | 1000.6 | 501 | 491 | 110.8 |
| A | 6 | 16 | 79896 | 716.34 | 501 | 491 | 110.8 |
| A | 5 | 168 | 58824 | 526.24 | 501 | 491 | 110.8 |
| B | 5 | 172 | 609785 | 6221.63 | 498 | 486 | 97.9 |
| B | 0 | 189 | 132609 | 1349.12 | 498 | 486 | 97.9 |
| B | 3 | 112 | 57309 | 580.23 | 498 | 486 | 97.9 |
| C | 4 | 254 | 897873 | 7616.27 | 483 | 480 | 117.8 |
| C | 3 | 233 | 220934 | 1871.02 | 483 | 480 | 117.8 |
| C | 0 | 207 | 16573 | 136.58 | 483 | 480 | 117.8 |
| D | 7 | 80 | 5168728 | 55606.9 | 387 | 374 | 92.9 |
| D | 1 | 52 | 1730544 | 18615.09 | 387 | 374 | 92.9 |
| D | 2 | 250 | 265646 | 2854.09 | 387 | 374 | 92.9 |
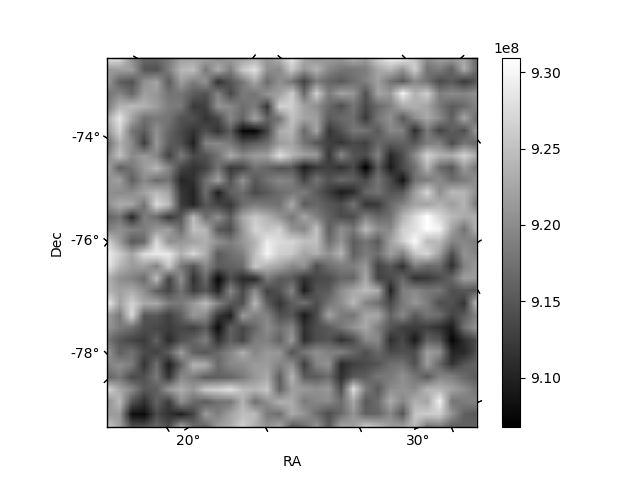
Histogram calculated using DETX and DETY for each event in the final _common_clean file
| Quadrant A |  |
 |
Quadrant B |
|---|---|---|---|
| Quadrant D |  |
 |
Quadrant C |
| Plot type | Count rate plots | Images |
|---|---|---|
| Comparison with Poisson distribution Blue bars denote a histogram of data divided into 1 sec bins. Red curve is a Poisson curve with rate = median count rate of data. |
 |
 |
| Quadrant-wise count rates Data is divided into 100 sec bins |
 |
|
| Module-wise count rates for Quadrant A Data is divided into 100 sec bins |
 |
 |
| Module-wise count rates for Quadrant B Data is divided into 100 sec bins |
 |
 |
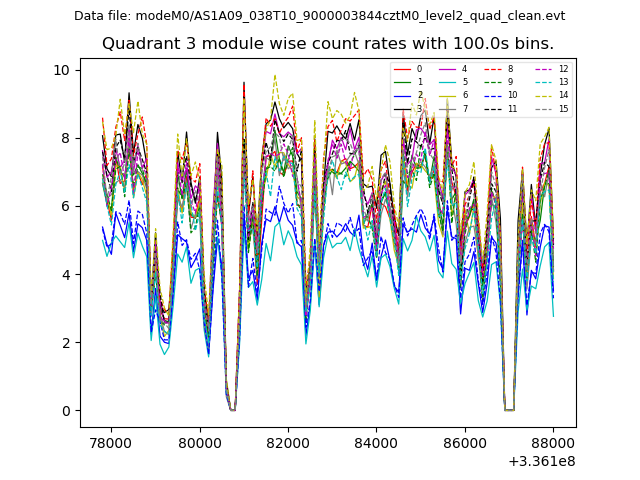
| Module-wise count rates for Quadrant C Data is divided into 100 sec bins |
 |
 |
| Module-wise count rates for Quadrant D Data is divided into 100 sec bins |
 |
 |
| Parameter | Plot |
|---|---|
| CZT HV Monitor |  |
| D_VDD |  |
| Temperature 1 |  |
| Veto HV Monitor |  |
| Veto LLD |  |
| Alpha Counter | 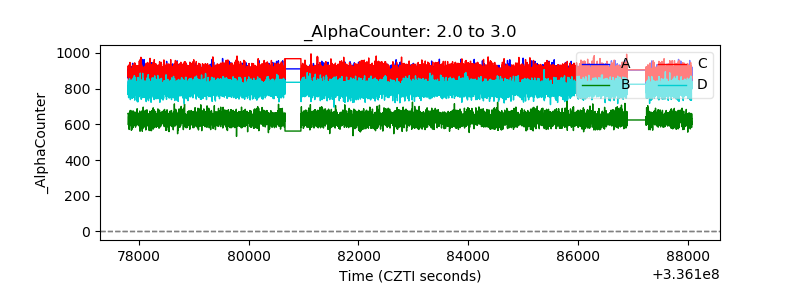 |
| _CPM_Rate |  |
| CZT Counter | 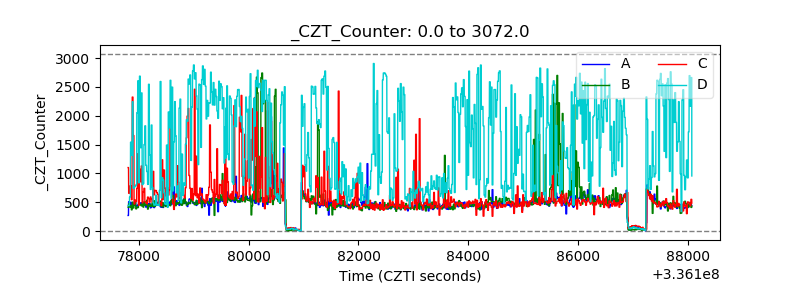 |
| +2.5 Volts monitor |  |
| +5 Volts monitor |  |
| _ROLL_ROT |  |
| _Roll_DEC |  |
| _Roll_RA |  |
| Veto Counter |  |