| Param | Original file | Final file |
|---|---|---|
| Filename | modeM0/AS1A09_095T02_9000003840cztM0_level2_bc.evt | modeM0/AS1A09_095T02_9000003840cztM0_level2_quad_clean.evt |
| Size (bytes) | 5,709,559,680 | 1,891,437,120 |
| Size | 5.3 GB | 1.8 GB |
| Events in quadrant A | 29,422,973 | 12,786,707 |
| Events in quadrant B | 31,213,406 | 12,926,850 |
| Events in quadrant C | 34,666,698 | 12,260,448 |
| Events in quadrant D | 69,855,736 | 11,496,499 |
| Mode M9 | |||
|---|---|---|---|
| Quadrant | BADHDUFLAG | Total packets | Discarded packets |
| A | 0 | 185 | 0 |
| B | 0 | 185 | 0 |
| C | 0 | 185 | 0 |
| D | 0 | 185 | 0 |
| Mode SS | |||
|---|---|---|---|
| Quadrant | BADHDUFLAG | Total packets | Discarded packets |
| A | 0 | 2320 | 0 |
| B | 0 | 2320 | 0 |
| C | 0 | 2320 | 0 |
| D | 0 | 2320 | 0 |
| Mode M0 | |||
|---|---|---|---|
| Quadrant | BADHDUFLAG | Total packets | Discarded packets |
| A | 0 | 251131 | 0 |
| B | 0 | 258747 | 0 |
| C | 0 | 278231 | 0 |
| D | 0 | 405200 | 0 |
| Quadrant | Total seconds | Saturated seconds | Saturation percentage |
|---|---|---|---|
| A | 114119 | 1674 | 1.466890% |
| B | 114119 | 2486 | 2.178428% |
| C | 114119 | 5051 | 4.426082% |
| D | 114119 | 14778 | 12.949640% |
Noise dominated data is calculated using 1-second bins in cleaned event files. If a bin has >2000 counts, and if more than 50% of those come from <1% of pixels, then it is considered to be noise-dominated and hence unusable.
| Quadrant | # 1 sec bins | Bins with >0 counts | Bins with >2000 counts | High rate bins dominated by noise | Noise dominated (total time) | Noise dominated (detector-on time) | Marked lightcurve |
|---|---|---|---|---|---|---|---|
| A | 132244 | 114113 | 180 | 180 | 0.14% | 0.16% | 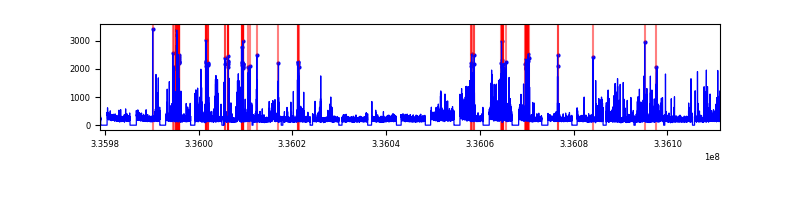 |
| B | 132244 | 114108 | 234 | 234 | 0.18% | 0.21% | 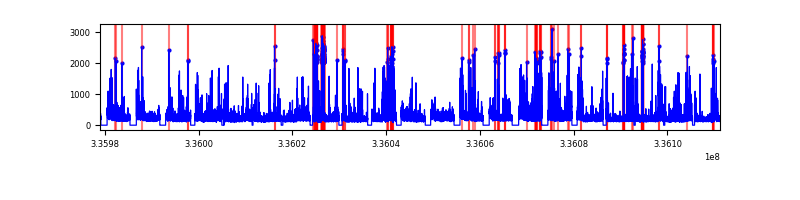 |
| C | 132244 | 114109 | 519 | 519 | 0.39% | 0.45% |  |
| D | 132244 | 114108 | 3263 | 3263 | 2.47% | 2.86% |  |
Top three noisy pixels from each quadrant. If the there are fewer than three noisy pixels in the level2.evt file, extra rows are filled as -1
| Pixel properties | Quadrant properties | ||||||
|---|---|---|---|---|---|---|---|
| Quadrant | DetID | PixID | Counts | Sigma | Mean | Median | Sigma |
| A | 0 | 13 | 3529555 | 2588.25 | 6328 | 6239 | 1361.3 |
| A | 5 | 168 | 994029 | 725.64 | 6328 | 6239 | 1361.3 |
| A | 9 | 130 | 470686 | 341.18 | 6328 | 6239 | 1361.3 |
| B | 3 | 64 | 4156901 | 3493.11 | 6354 | 6222 | 1188.2 |
| B | 3 | 112 | 1141674 | 955.57 | 6354 | 6222 | 1188.2 |
| B | 5 | 172 | 1023954 | 856.5 | 6354 | 6222 | 1188.2 |
| C | 4 | 254 | 6831951 | 4803.97 | 6013 | 6021 | 1420.9 |
| C | 3 | 233 | 3098031 | 2176.1 | 6013 | 6021 | 1420.9 |
| C | 15 | 127 | 1567246 | 1098.76 | 6013 | 6021 | 1420.9 |
| D | 1 | 52 | 23496196 | 17376.33 | 5859 | 5726 | 1351.9 |
| D | 7 | 80 | 18887836 | 13967.44 | 5859 | 5726 | 1351.9 |
| D | 2 | 250 | 2124274 | 1567.13 | 5859 | 5726 | 1351.9 |
Histogram calculated using DETX and DETY for each event in the final _common_clean file
| Quadrant A |  |
 |
Quadrant B |
|---|---|---|---|
| Quadrant D | 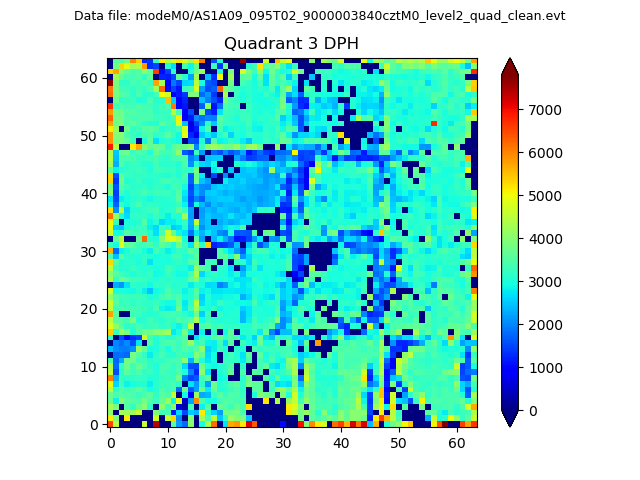 |
 |
Quadrant C |
| Plot type | Count rate plots | Images |
|---|---|---|
| Comparison with Poisson distribution Blue bars denote a histogram of data divided into 1 sec bins. Red curve is a Poisson curve with rate = median count rate of data. |
 |
 |
| Quadrant-wise count rates Data is divided into 100 sec bins |
 |
|
| Module-wise count rates for Quadrant A Data is divided into 100 sec bins |
 |
 |
| Module-wise count rates for Quadrant B Data is divided into 100 sec bins |
 |
 |
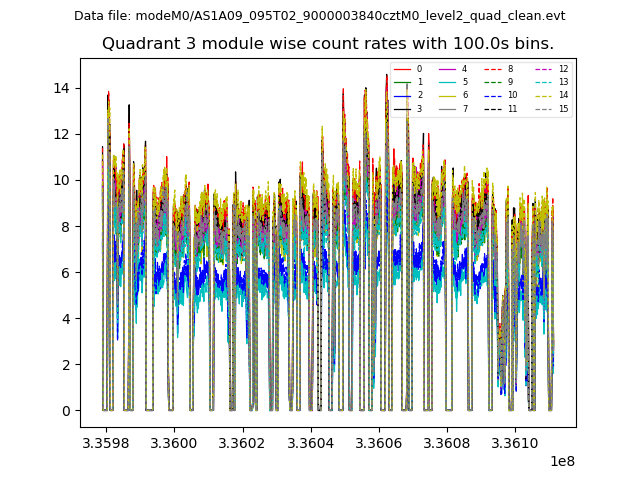
| Module-wise count rates for Quadrant C Data is divided into 100 sec bins |
 |
 |
| Module-wise count rates for Quadrant D Data is divided into 100 sec bins |
 |
 |
| Parameter | Plot |
|---|---|
| CZT HV Monitor |  |
| D_VDD | 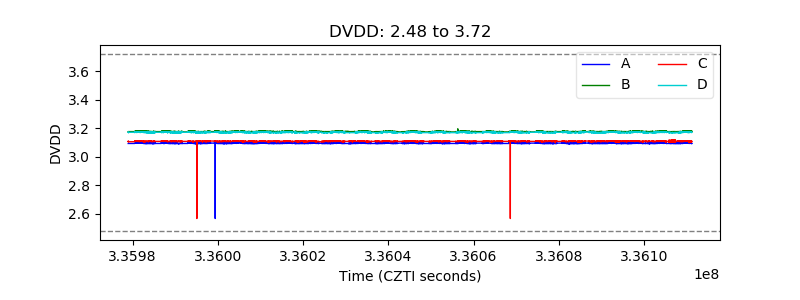 |
| Temperature 1 |  |
| Veto HV Monitor |  |
| Veto LLD |  |
| Alpha Counter | 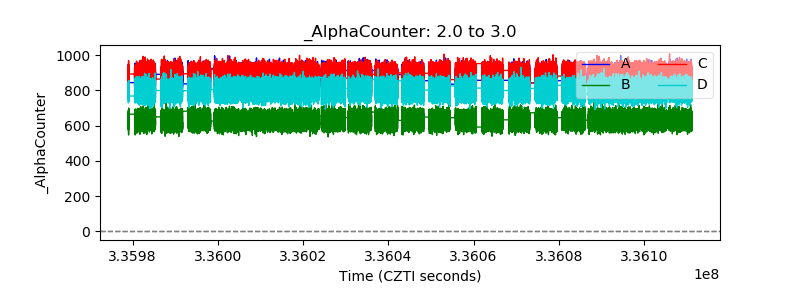 |
| _CPM_Rate | 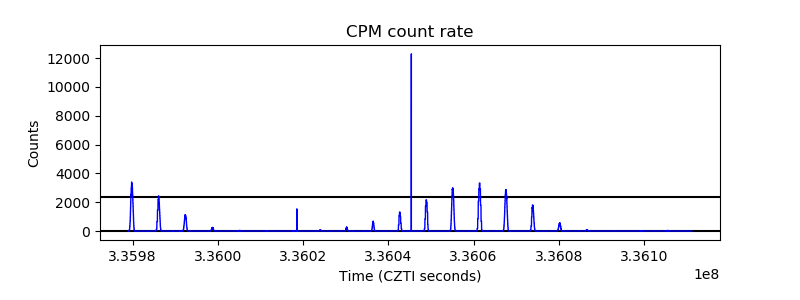 |
| CZT Counter |  |
| +2.5 Volts monitor |  |
| +5 Volts monitor |  |
| _ROLL_ROT |  |
| _Roll_DEC |  |
| _Roll_RA |  |
| Veto Counter |  |