| Param | Original file | Final file |
|---|---|---|
| Filename | modeM0/AS1C05_019T04_9000003838cztM0_level2_bc.evt | modeM0/AS1C05_019T04_9000003838cztM0_level2_quad_clean.evt |
| Size (bytes) | 1,243,460,160 | 470,191,680 |
| Size | 1.2 GB | 448.4 MB |
| Events in quadrant A | 6,232,730 | 3,288,387 |
| Events in quadrant B | 9,310,668 | 3,089,003 |
| Events in quadrant C | 7,381,850 | 3,090,908 |
| Events in quadrant D | 12,944,513 | 2,971,061 |
| Mode SS | |||
|---|---|---|---|
| Quadrant | BADHDUFLAG | Total packets | Discarded packets |
| A | 0 | 538 | 0 |
| B | 0 | 538 | 0 |
| C | 0 | 536 | 0 |
| D | 0 | 540 | 0 |
| Mode M9 | |||
|---|---|---|---|
| Quadrant | BADHDUFLAG | Total packets | Discarded packets |
| A | 0 | 42 | 0 |
| B | 0 | 43 | 0 |
| C | 0 | 43 | 0 |
| D | 0 | 43 | 0 |
| Mode M0 | |||
|---|---|---|---|
| Quadrant | BADHDUFLAG | Total packets | Discarded packets |
| A | 0 | 56165 | 0 |
| B | 0 | 71255 | 0 |
| C | 0 | 62071 | 0 |
| D | 0 | 82818 | 0 |
| Quadrant | Total seconds | Saturated seconds | Saturation percentage |
|---|---|---|---|
| A | 26355 | 221 | 0.838551% |
| B | 25963 | 1918 | 7.387436% |
| C | 26209 | 905 | 3.453012% |
| D | 26182 | 2181 | 8.330150% |
Noise dominated data is calculated using 1-second bins in cleaned event files. If a bin has >2000 counts, and if more than 50% of those come from <1% of pixels, then it is considered to be noise-dominated and hence unusable.
| Quadrant | # 1 sec bins | Bins with >0 counts | Bins with >2000 counts | High rate bins dominated by noise | Noise dominated (total time) | Noise dominated (detector-on time) | Marked lightcurve |
|---|---|---|---|---|---|---|---|
| A | 85062 | 26749 | 3 | 3 | 0.00% | 0.01% | 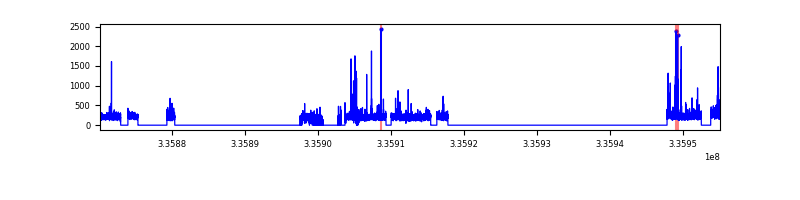 |
| B | 85062 | 26265 | 52 | 52 | 0.06% | 0.20% |  |
| C | 85061 | 26648 | 54 | 54 | 0.06% | 0.20% |  |
| D | 85061 | 26600 | 215 | 215 | 0.25% | 0.81% |  |
Top three noisy pixels from each quadrant. If the there are fewer than three noisy pixels in the level2.evt file, extra rows are filled as -1
| Pixel properties | Quadrant properties | ||||||
|---|---|---|---|---|---|---|---|
| Quadrant | DetID | PixID | Counts | Sigma | Mean | Median | Sigma |
| A | 0 | 13 | 280819 | 832.91 | 1505 | 1482 | 335.4 |
| A | 6 | 16 | 77211 | 225.8 | 1505 | 1482 | 335.4 |
| A | 13 | 254 | 42415 | 122.05 | 1505 | 1482 | 335.4 |
| B | 0 | 189 | 2205343 | 7992.7 | 1422 | 1396 | 275.7 |
| B | 7 | 205 | 982952 | 3559.65 | 1422 | 1396 | 275.7 |
| B | 3 | 112 | 139112 | 499.43 | 1422 | 1396 | 275.7 |
| C | 1 | 0 | 1043017 | 3091.64 | 1411 | 1414 | 336.9 |
| C | 3 | 233 | 491967 | 1456.04 | 1411 | 1414 | 336.9 |
| C | 15 | 208 | 204366 | 602.39 | 1411 | 1414 | 336.9 |
| D | 7 | 80 | 4043641 | 11053.88 | 1402 | 1366 | 365.7 |
| D | 1 | 52 | 2221865 | 6072.11 | 1402 | 1366 | 365.7 |
| D | 2 | 250 | 795719 | 2172.21 | 1402 | 1366 | 365.7 |
Histogram calculated using DETX and DETY for each event in the final _common_clean file
| Quadrant A |  |
 |
Quadrant B |
|---|---|---|---|
| Quadrant D |  |
 |
Quadrant C |
| Plot type | Count rate plots | Images |
|---|---|---|
| Comparison with Poisson distribution Blue bars denote a histogram of data divided into 1 sec bins. Red curve is a Poisson curve with rate = median count rate of data. |
 |
 |
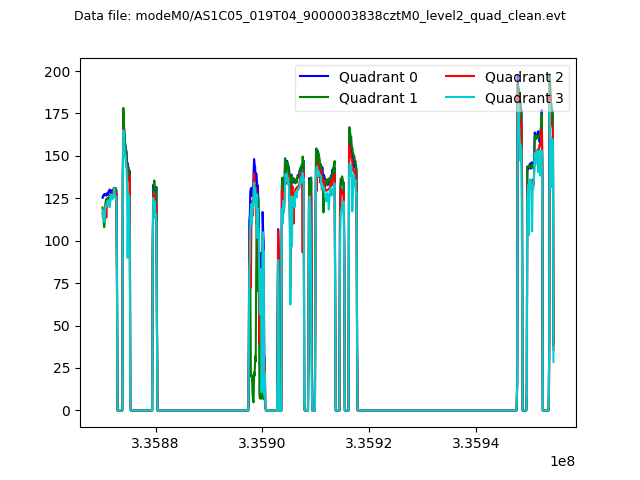
| Quadrant-wise count rates Data is divided into 100 sec bins |
 |
|
| Module-wise count rates for Quadrant A Data is divided into 100 sec bins |
 |
 |
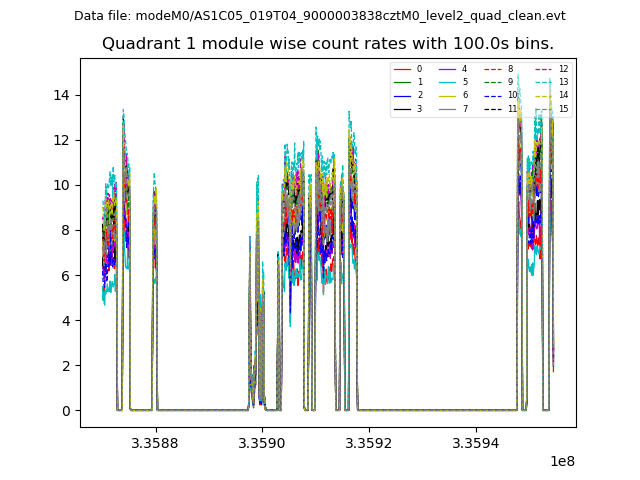
| Module-wise count rates for Quadrant B Data is divided into 100 sec bins |
 |
 |
| Module-wise count rates for Quadrant C Data is divided into 100 sec bins |
 |
 |
| Module-wise count rates for Quadrant D Data is divided into 100 sec bins |
 |
 |
| Parameter | Plot |
|---|---|
| CZT HV Monitor |  |
| D_VDD | 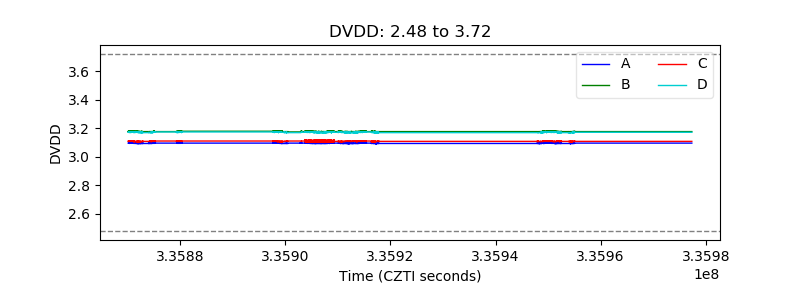 |
| Temperature 1 | 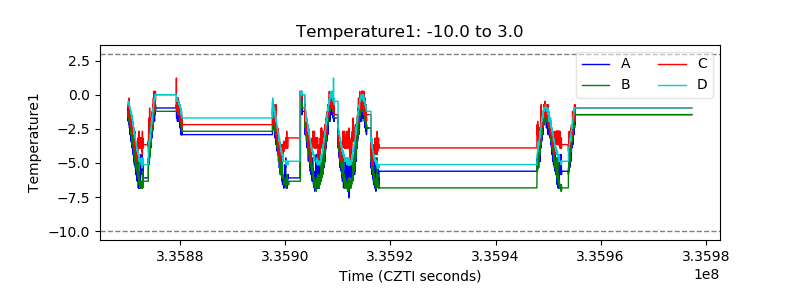 |
| Veto HV Monitor | 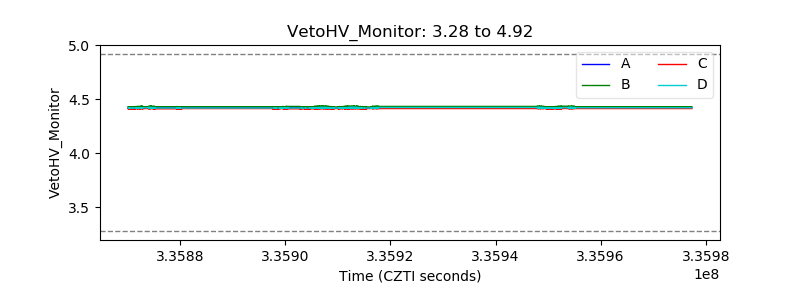 |
| Veto LLD |  |
| Alpha Counter |  |
| _CPM_Rate |  |
| CZT Counter |  |
| +2.5 Volts monitor |  |
| +5 Volts monitor |  |
| _ROLL_ROT |  |
| _Roll_DEC |  |
| _Roll_RA | 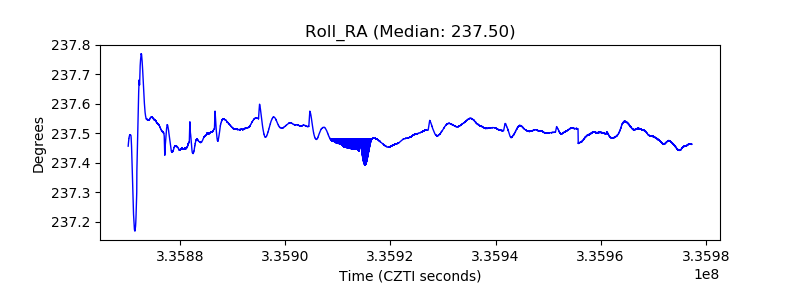 |
| Veto Counter |  |