| Param | Original file | Final file |
|---|---|---|
| Filename | modeM0/AS1C05_017T01_9000003836cztM0_level2_bc.evt | modeM0/AS1C05_017T01_9000003836cztM0_level2_quad_clean.evt |
| Size (bytes) | 5,190,192,000 | 1,435,066,560 |
| Size | 4.8 GB | 1.3 GB |
| Events in quadrant A | 23,491,431 | 9,422,054 |
| Events in quadrant B | 35,109,789 | 9,418,470 |
| Events in quadrant C | 28,030,703 | 9,078,572 |
| Events in quadrant D | 63,604,057 | 8,540,196 |
| Mode M9 | |||
|---|---|---|---|
| Quadrant | BADHDUFLAG | Total packets | Discarded packets |
| A | 0 | 148 | 0 |
| B | 0 | 148 | 0 |
| C | 0 | 149 | 0 |
| D | 0 | 147 | 0 |
| Mode SS | |||
|---|---|---|---|
| Quadrant | BADHDUFLAG | Total packets | Discarded packets |
| A | 0 | 1982 | 0 |
| B | 0 | 2076 | 0 |
| C | 0 | 2078 | 0 |
| D | 0 | 2080 | 0 |
| Mode M0 | |||
|---|---|---|---|
| Quadrant | BADHDUFLAG | Total packets | Discarded packets |
| A | 0 | 217031 | 0 |
| B | 0 | 261648 | 0 |
| C | 0 | 241670 | 0 |
| D | 0 | 367513 | 0 |
| Quadrant | Total seconds | Saturated seconds | Saturation percentage |
|---|---|---|---|
| A | 102339 | 1203 | 1.175505% |
| B | 102344 | 4921 | 4.808294% |
| C | 102337 | 2868 | 2.802505% |
| D | 102338 | 13748 | 13.433915% |
Noise dominated data is calculated using 1-second bins in cleaned event files. If a bin has >2000 counts, and if more than 50% of those come from <1% of pixels, then it is considered to be noise-dominated and hence unusable.
| Quadrant | # 1 sec bins | Bins with >0 counts | Bins with >2000 counts | High rate bins dominated by noise | Noise dominated (total time) | Noise dominated (detector-on time) | Marked lightcurve |
|---|---|---|---|---|---|---|---|
| A | 116886 | 102353 | 1 | 1 | 0.00% | 0.00% |  |
| B | 116886 | 102345 | 67 | 67 | 0.06% | 0.07% |  |
| C | 116886 | 102336 | 125 | 125 | 0.11% | 0.12% |  |
| D | 116886 | 102347 | 2277 | 2277 | 1.95% | 2.22% |  |
Top three noisy pixels from each quadrant. If the there are fewer than three noisy pixels in the level2.evt file, extra rows are filled as -1
| Pixel properties | Quadrant properties | ||||||
|---|---|---|---|---|---|---|---|
| Quadrant | DetID | PixID | Counts | Sigma | Mean | Median | Sigma |
| A | 6 | 16 | 281929 | 209.02 | 6008 | 5912 | 1320.5 |
| A | 13 | 254 | 162196 | 118.35 | 6008 | 5912 | 1320.5 |
| A | 12 | 194 | 38632 | 24.78 | 6008 | 5912 | 1320.5 |
| B | 0 | 189 | 6764835 | 5914.71 | 5984 | 5894 | 1142.7 |
| B | 7 | 205 | 4051893 | 3540.63 | 5984 | 5894 | 1142.7 |
| B | 5 | 172 | 351933 | 302.82 | 5984 | 5894 | 1142.7 |
| C | 3 | 233 | 3670658 | 2691.48 | 5739 | 5763 | 1361.7 |
| C | 4 | 254 | 1199907 | 876.97 | 5739 | 5763 | 1361.7 |
| C | 2 | 16 | 796287 | 580.56 | 5739 | 5763 | 1361.7 |
| D | 1 | 52 | 33228668 | 25356.42 | 5560 | 5433 | 1310.2 |
| D | 12 | 233 | 5673677 | 4326.08 | 5560 | 5433 | 1310.2 |
| D | 7 | 80 | 1689038 | 1284.95 | 5560 | 5433 | 1310.2 |
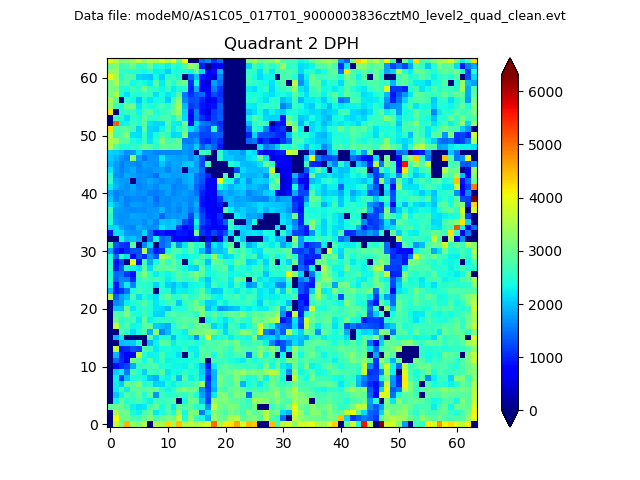
Histogram calculated using DETX and DETY for each event in the final _common_clean file
| Quadrant A |  |
 |
Quadrant B |
|---|---|---|---|
| Quadrant D |  |
 |
Quadrant C |
| Plot type | Count rate plots | Images |
|---|---|---|
| Comparison with Poisson distribution Blue bars denote a histogram of data divided into 1 sec bins. Red curve is a Poisson curve with rate = median count rate of data. |
 |
 |
| Quadrant-wise count rates Data is divided into 100 sec bins |
 |
|
| Module-wise count rates for Quadrant A Data is divided into 100 sec bins |
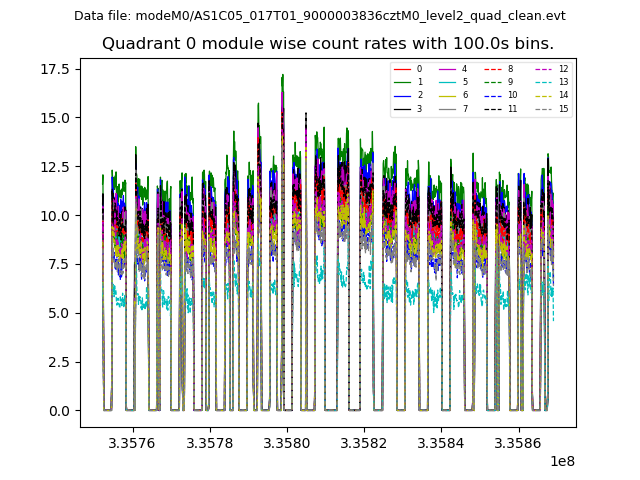 |
 |
| Module-wise count rates for Quadrant B Data is divided into 100 sec bins |
 |
 |
| Module-wise count rates for Quadrant C Data is divided into 100 sec bins |
 |
 |
| Module-wise count rates for Quadrant D Data is divided into 100 sec bins |
 |
 |
| Parameter | Plot |
|---|---|
| CZT HV Monitor |  |
| D_VDD |  |
| Temperature 1 |  |
| Veto HV Monitor |  |
| Veto LLD |  |
| Alpha Counter |  |
| _CPM_Rate |  |
| CZT Counter |  |
| +2.5 Volts monitor |  |
| +5 Volts monitor |  |
| _ROLL_ROT |  |
| _Roll_DEC |  |
| _Roll_RA | 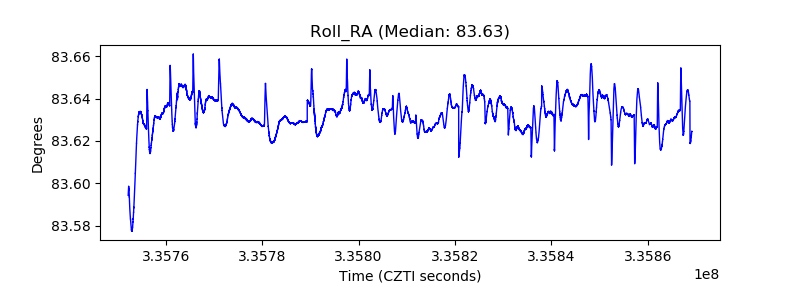 |
| Veto Counter |  |