| Param | Original file | Final file |
|---|---|---|
| Filename | modeM0/AS1A09_120T02_9000003834cztM0_level2_bc.evt | modeM0/AS1A09_120T02_9000003834cztM0_level2_quad_clean.evt |
| Size (bytes) | 170,654,400 | 63,449,280 |
| Size | 162.7 MB | 60.5 MB |
| Events in quadrant A | 668,452 | 441,145 |
| Events in quadrant B | 683,874 | 446,959 |
| Events in quadrant C | 738,933 | 426,847 |
| Events in quadrant D | 2,856,256 | 383,729 |
| Mode SS | |||
|---|---|---|---|
| Quadrant | BADHDUFLAG | Total packets | Discarded packets |
| A | 0 | 64 | 0 |
| B | 0 | 64 | 0 |
| C | 0 | 64 | 0 |
| D | 0 | 64 | 0 |
| Mode M0 | |||
|---|---|---|---|
| Quadrant | BADHDUFLAG | Total packets | Discarded packets |
| A | 0 | 6287 | 0 |
| B | 0 | 6307 | 0 |
| C | 0 | 6501 | 0 |
| D | 0 | 13986 | 0 |
| Quadrant | Total seconds | Saturated seconds | Saturation percentage |
|---|---|---|---|
| A | 3126 | 3 | 0.095969% |
| B | 3126 | 4 | 0.127959% |
| C | 3126 | 13 | 0.415867% |
| D | 3126 | 509 | 16.282790% |
Noise dominated data is calculated using 1-second bins in cleaned event files. If a bin has >2000 counts, and if more than 50% of those come from <1% of pixels, then it is considered to be noise-dominated and hence unusable.
| Quadrant | # 1 sec bins | Bins with >0 counts | Bins with >2000 counts | High rate bins dominated by noise | Noise dominated (total time) | Noise dominated (detector-on time) | Marked lightcurve |
|---|---|---|---|---|---|---|---|
| A | 3126 | 3126 | 0 | 0 | 0.00% | 0.00% |  |
| B | 3126 | 3126 | 0 | 0 | 0.00% | 0.00% |  |
| C | 3126 | 3126 | 0 | 0 | 0.00% | 0.00% |  |
| D | 3126 | 3126 | 164 | 164 | 5.25% | 5.25% |  |
Top three noisy pixels from each quadrant. If the there are fewer than three noisy pixels in the level2.evt file, extra rows are filled as -1
| Pixel properties | Quadrant properties | ||||||
|---|---|---|---|---|---|---|---|
| Quadrant | DetID | PixID | Counts | Sigma | Mean | Median | Sigma |
| A | 13 | 254 | 4762 | 107.22 | 173 | 170 | 42.8 |
| A | 0 | 226 | 1083 | 21.32 | 173 | 170 | 42.8 |
| A | 12 | 194 | 1024 | 19.94 | 173 | 170 | 42.8 |
| B | 0 | 219 | 9781 | 251.49 | 174 | 171 | 38.2 |
| B | 0 | 229 | 7140 | 182.37 | 174 | 171 | 38.2 |
| B | 3 | 112 | 2159 | 52.02 | 174 | 171 | 38.2 |
| C | 3 | 233 | 94277 | 2142.65 | 166 | 166 | 43.9 |
| C | 4 | 254 | 4102 | 89.61 | 166 | 166 | 43.9 |
| C | 13 | 61 | 967 | 18.24 | 166 | 166 | 43.9 |
| D | 1 | 52 | 1538213 | 37927.5 | 157 | 152 | 40.6 |
| D | 7 | 80 | 533016 | 13140.04 | 157 | 152 | 40.6 |
| D | 12 | 233 | 166485 | 4101.64 | 157 | 152 | 40.6 |
Histogram calculated using DETX and DETY for each event in the final _common_clean file
| Quadrant A | 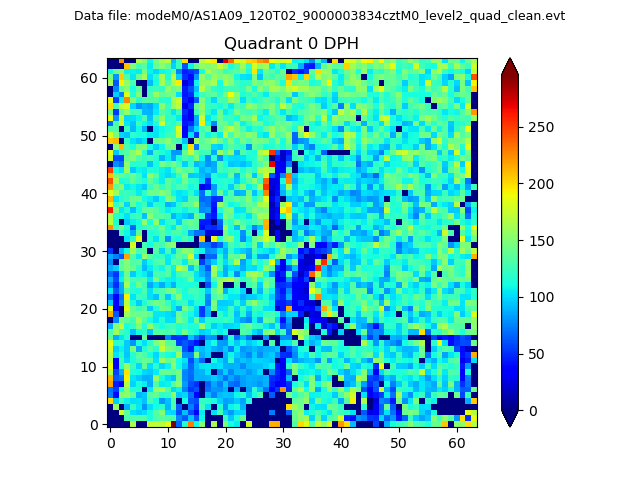 |
 |
Quadrant B |
|---|---|---|---|
| Quadrant D |  |
 |
Quadrant C |
| Plot type | Count rate plots | Images |
|---|---|---|
| Comparison with Poisson distribution Blue bars denote a histogram of data divided into 1 sec bins. Red curve is a Poisson curve with rate = median count rate of data. |
 |
 |
| Quadrant-wise count rates Data is divided into 100 sec bins |
 |
|
| Module-wise count rates for Quadrant A Data is divided into 100 sec bins |
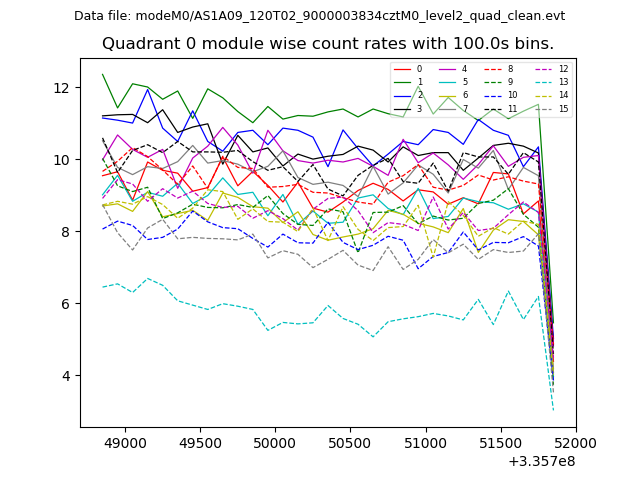 |
 |
| Module-wise count rates for Quadrant B Data is divided into 100 sec bins |
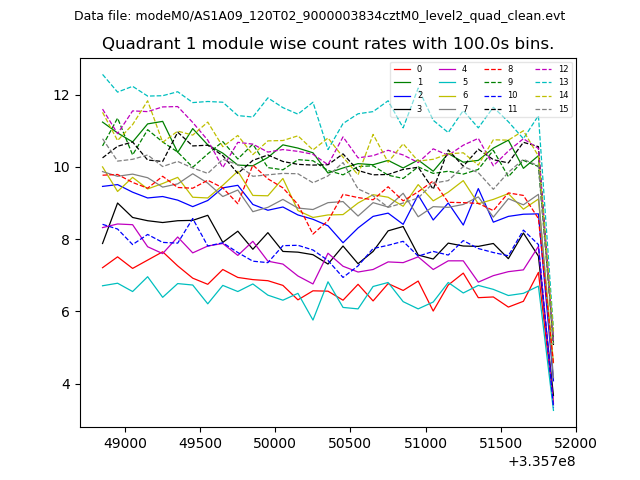 |
 |
| Module-wise count rates for Quadrant C Data is divided into 100 sec bins |
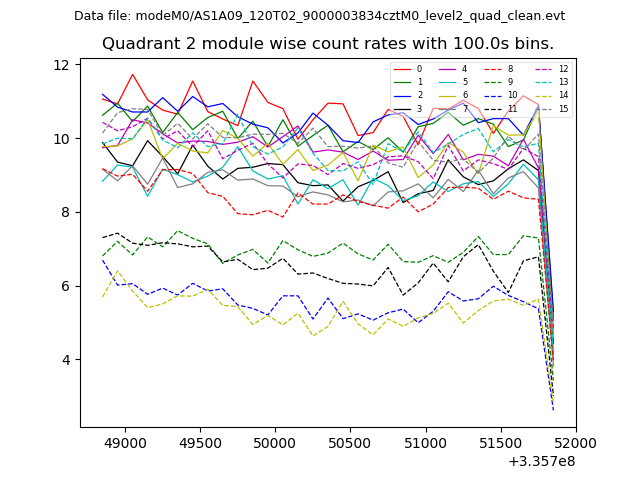 |
 |
| Module-wise count rates for Quadrant D Data is divided into 100 sec bins |
 |
 |
| Parameter | Plot |
|---|---|
| CZT HV Monitor |  |
| D_VDD |  |
| Temperature 1 |  |
| Veto HV Monitor |  |
| Veto LLD |  |
| Alpha Counter |  |
| _CPM_Rate |  |
| CZT Counter |  |
| +2.5 Volts monitor |  |
| +5 Volts monitor | 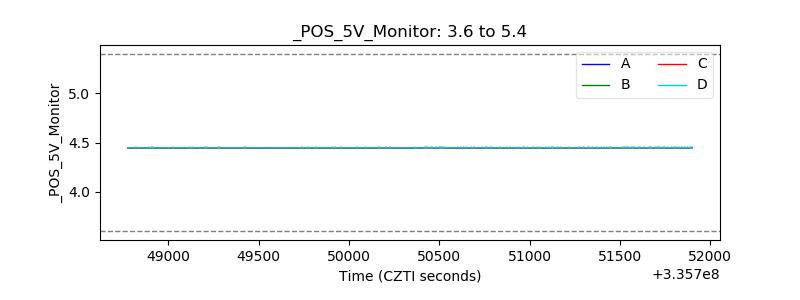 |
| _ROLL_ROT | 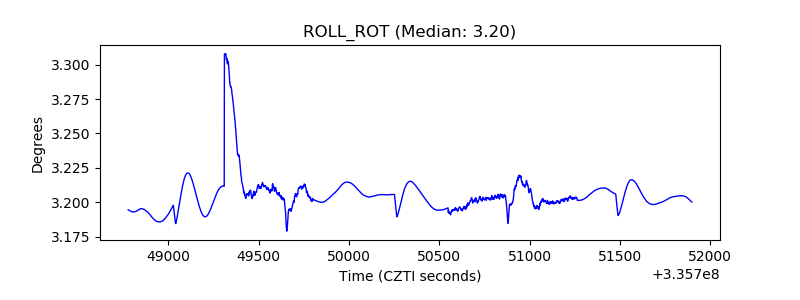 |
| _Roll_DEC |  |
| _Roll_RA |  |
| Veto Counter |  |