| Param | Original file | Final file |
|---|---|---|
| Filename | modeM0/AS1A09_038T06_9000003832cztM0_level2_bc.evt | modeM0/AS1A09_038T06_9000003832cztM0_level2_quad_clean.evt |
| Size (bytes) | 1,269,457,920 | 498,660,480 |
| Size | 1.2 GB | 475.6 MB |
| Events in quadrant A | 6,355,779 | 3,556,349 |
| Events in quadrant B | 6,077,744 | 3,637,350 |
| Events in quadrant C | 5,744,203 | 3,442,627 |
| Events in quadrant D | 18,613,956 | 2,808,904 |
| Mode SS | |||
|---|---|---|---|
| Quadrant | BADHDUFLAG | Total packets | Discarded packets |
| A | 0 | 500 | 0 |
| B | 0 | 502 | 0 |
| C | 0 | 502 | 0 |
| D | 0 | 494 | 0 |
| Mode M0 | |||
|---|---|---|---|
| Quadrant | BADHDUFLAG | Total packets | Discarded packets |
| A | 0 | 53720 | 0 |
| B | 0 | 53118 | 0 |
| C | 0 | 52520 | 0 |
| D | 0 | 102597 | 0 |
| Mode M9 | |||
|---|---|---|---|
| Quadrant | BADHDUFLAG | Total packets | Discarded packets |
| A | 0 | 56 | 0 |
| B | 0 | 56 | 0 |
| C | 0 | 55 | 0 |
| D | 0 | 56 | 0 |
| Quadrant | Total seconds | Saturated seconds | Saturation percentage |
|---|---|---|---|
| A | 24123 | 182 | 0.754467% |
| B | 24242 | 287 | 1.183896% |
| C | 24221 | 365 | 1.506957% |
| D | 23660 | 5822 | 24.606932% |
Noise dominated data is calculated using 1-second bins in cleaned event files. If a bin has >2000 counts, and if more than 50% of those come from <1% of pixels, then it is considered to be noise-dominated and hence unusable.
| Quadrant | # 1 sec bins | Bins with >0 counts | Bins with >2000 counts | High rate bins dominated by noise | Noise dominated (total time) | Noise dominated (detector-on time) | Marked lightcurve |
|---|---|---|---|---|---|---|---|
| A | 23853 | 20225 | 1 | 1 | 0.00% | 0.00% |  |
| B | 23853 | 20240 | 8 | 8 | 0.03% | 0.04% |  |
| C | 23853 | 20250 | 3 | 3 | 0.01% | 0.01% |  |
| D | 23853 | 19756 | 1803 | 1803 | 7.56% | 9.13% |  |
Top three noisy pixels from each quadrant. If the there are fewer than three noisy pixels in the level2.evt file, extra rows are filled as -1
| Pixel properties | Quadrant properties | ||||||
|---|---|---|---|---|---|---|---|
| Quadrant | DetID | PixID | Counts | Sigma | Mean | Median | Sigma |
| A | 0 | 13 | 428029 | 1391.33 | 1426 | 1410 | 306.6 |
| A | 13 | 170 | 423709 | 1377.24 | 1426 | 1410 | 306.6 |
| A | 13 | 254 | 39054 | 122.77 | 1426 | 1410 | 306.6 |
| B | 0 | 189 | 242417 | 901.45 | 1447 | 1426 | 267.3 |
| B | 0 | 190 | 58967 | 215.24 | 1447 | 1426 | 267.3 |
| B | 3 | 112 | 35306 | 126.73 | 1447 | 1426 | 267.3 |
| C | 3 | 233 | 324161 | 1001.95 | 1365 | 1371 | 322.2 |
| C | 4 | 254 | 82888 | 253.03 | 1365 | 1371 | 322.2 |
| C | 2 | 16 | 57276 | 173.53 | 1365 | 1371 | 322.2 |
| D | 1 | 52 | 7143597 | 25924.45 | 1168 | 1146 | 275.5 |
| D | 7 | 80 | 5758084 | 20895.55 | 1168 | 1146 | 275.5 |
| D | 12 | 233 | 710245 | 2573.77 | 1168 | 1146 | 275.5 |
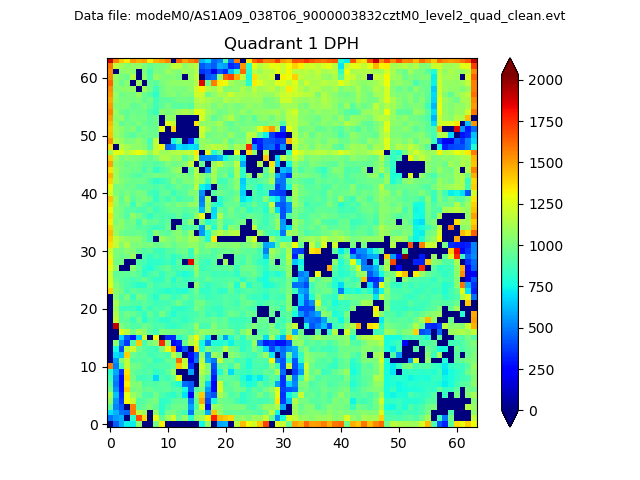
Histogram calculated using DETX and DETY for each event in the final _common_clean file
| Quadrant A |  |
 |
Quadrant B |
|---|---|---|---|
| Quadrant D | 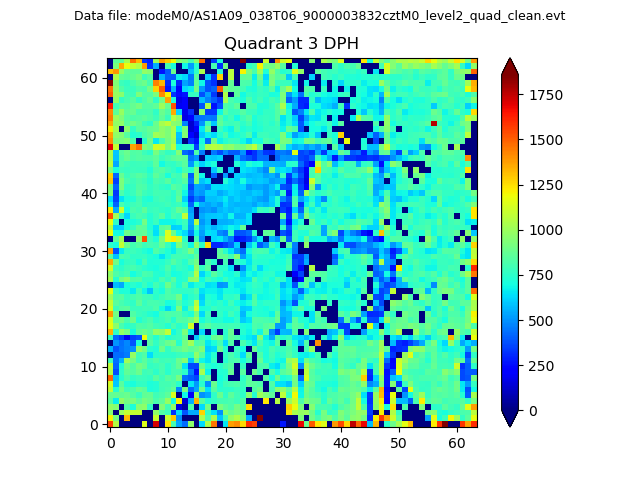 |
 |
Quadrant C |
| Plot type | Count rate plots | Images |
|---|---|---|
| Comparison with Poisson distribution Blue bars denote a histogram of data divided into 1 sec bins. Red curve is a Poisson curve with rate = median count rate of data. |
 |
 |
| Quadrant-wise count rates Data is divided into 100 sec bins |
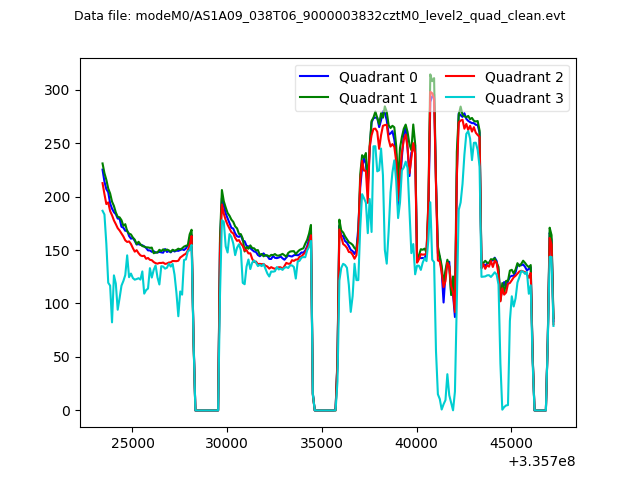 |
|
| Module-wise count rates for Quadrant A Data is divided into 100 sec bins |
 |
 |
| Module-wise count rates for Quadrant B Data is divided into 100 sec bins |
 |
 |
| Module-wise count rates for Quadrant C Data is divided into 100 sec bins |
 |
 |
| Module-wise count rates for Quadrant D Data is divided into 100 sec bins |
 |
 |
| Parameter | Plot |
|---|---|
| CZT HV Monitor |  |
| D_VDD | 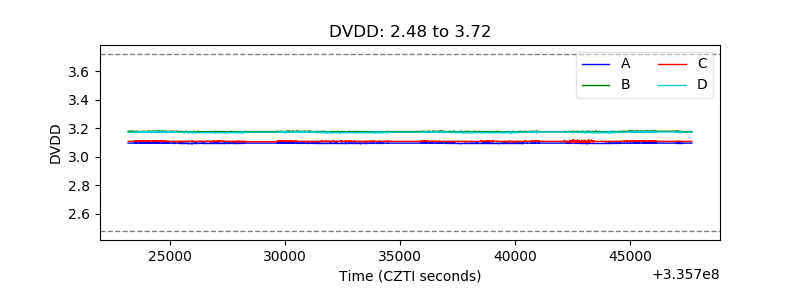 |
| Temperature 1 | 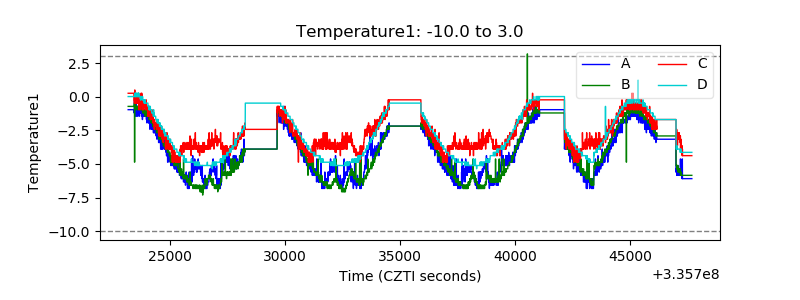 |
| Veto HV Monitor |  |
| Veto LLD |  |
| Alpha Counter | 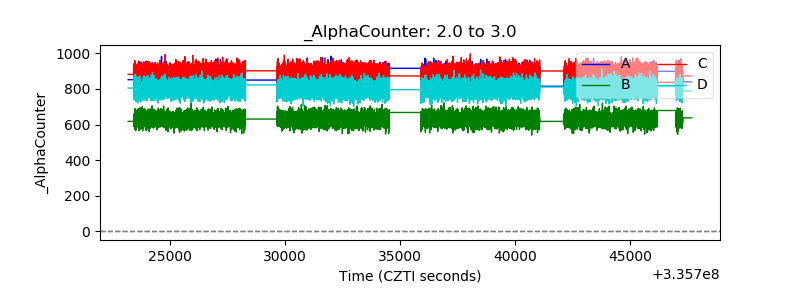 |
| _CPM_Rate |  |
| CZT Counter |  |
| +2.5 Volts monitor |  |
| +5 Volts monitor |  |
| _ROLL_ROT | 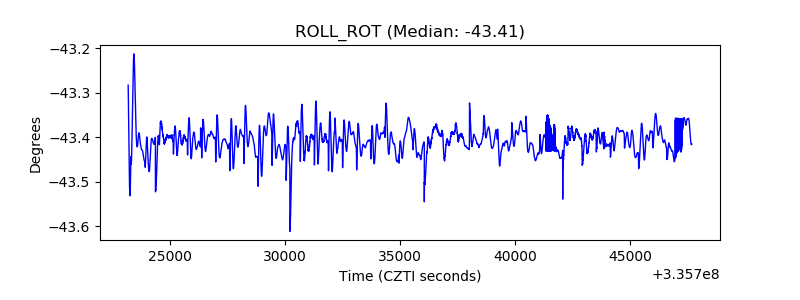 |
| _Roll_DEC |  |
| _Roll_RA |  |
| Veto Counter | 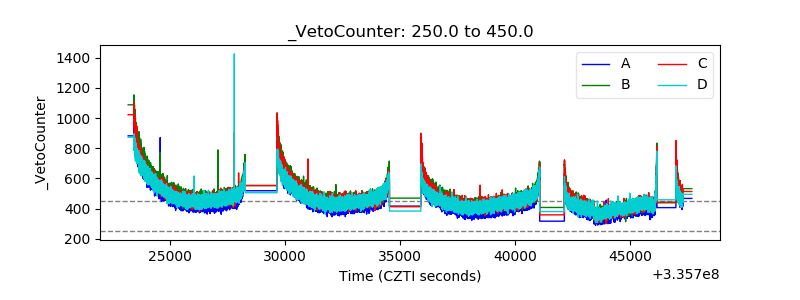 |