| Param | Original file | Final file |
|---|---|---|
| Filename | modeM0/AS1A09_038T05_9000003830cztM0_level2_bc.evt | modeM0/AS1A09_038T05_9000003830cztM0_level2_quad_clean.evt |
| Size (bytes) | 316,296,000 | 143,654,400 |
| Size | 301.6 MB | 137.0 MB |
| Events in quadrant A | 1,590,158 | 1,018,914 |
| Events in quadrant B | 1,645,457 | 1,034,148 |
| Events in quadrant C | 1,958,625 | 958,942 |
| Events in quadrant D | 3,933,814 | 884,428 |
| Mode M9 | |||
|---|---|---|---|
| Quadrant | BADHDUFLAG | Total packets | Discarded packets |
| A | 0 | 20 | 0 |
| B | 0 | 20 | 0 |
| C | 0 | 20 | 0 |
| D | 0 | 20 | 0 |
| Mode SS | |||
|---|---|---|---|
| Quadrant | BADHDUFLAG | Total packets | Discarded packets |
| A | 0 | 134 | 0 |
| B | 0 | 134 | 0 |
| C | 0 | 134 | 0 |
| D | 0 | 134 | 0 |
| Mode M0 | |||
|---|---|---|---|
| Quadrant | BADHDUFLAG | Total packets | Discarded packets |
| A | 0 | 14083 | 0 |
| B | 0 | 14265 | 0 |
| C | 0 | 16058 | 0 |
| D | 0 | 23811 | 0 |
| Quadrant | Total seconds | Saturated seconds | Saturation percentage |
|---|---|---|---|
| A | 6513 | 123 | 1.888531% |
| B | 6513 | 144 | 2.210963% |
| C | 6513 | 354 | 5.435283% |
| D | 6513 | 928 | 14.248426% |
Noise dominated data is calculated using 1-second bins in cleaned event files. If a bin has >2000 counts, and if more than 50% of those come from <1% of pixels, then it is considered to be noise-dominated and hence unusable.
| Quadrant | # 1 sec bins | Bins with >0 counts | Bins with >2000 counts | High rate bins dominated by noise | Noise dominated (total time) | Noise dominated (detector-on time) | Marked lightcurve |
|---|---|---|---|---|---|---|---|
| A | 7792 | 6511 | 0 | 0 | 0.00% | 0.00% |  |
| B | 7792 | 6511 | 1 | 1 | 0.01% | 0.02% |  |
| C | 7792 | 6511 | 18 | 18 | 0.23% | 0.28% |  |
| D | 7792 | 6511 | 142 | 142 | 1.82% | 2.18% |  |
Top three noisy pixels from each quadrant. If the there are fewer than three noisy pixels in the level2.evt file, extra rows are filled as -1
| Pixel properties | Quadrant properties | ||||||
|---|---|---|---|---|---|---|---|
| Quadrant | DetID | PixID | Counts | Sigma | Mean | Median | Sigma |
| A | 13 | 254 | 9558 | 103.92 | 412 | 408 | 88.0 |
| A | 0 | 226 | 2664 | 25.62 | 412 | 408 | 88.0 |
| A | 12 | 194 | 2559 | 24.43 | 412 | 408 | 88.0 |
| B | 0 | 229 | 15328 | 193.45 | 414 | 407 | 77.1 |
| B | 0 | 190 | 12651 | 158.74 | 414 | 407 | 77.1 |
| B | 3 | 209 | 8641 | 106.75 | 414 | 407 | 77.1 |
| C | 4 | 254 | 434877 | 4782.41 | 384 | 385 | 90.9 |
| C | 3 | 233 | 40607 | 442.72 | 384 | 385 | 90.9 |
| C | 8 | 222 | 3707 | 36.56 | 384 | 385 | 90.9 |
| D | 1 | 52 | 1556843 | 18094.68 | 367 | 357 | 86.0 |
| D | 7 | 80 | 540841 | 6283.31 | 367 | 357 | 86.0 |
| D | 11 | 176 | 329024 | 3820.87 | 367 | 357 | 86.0 |
Histogram calculated using DETX and DETY for each event in the final _common_clean file
| Quadrant A | 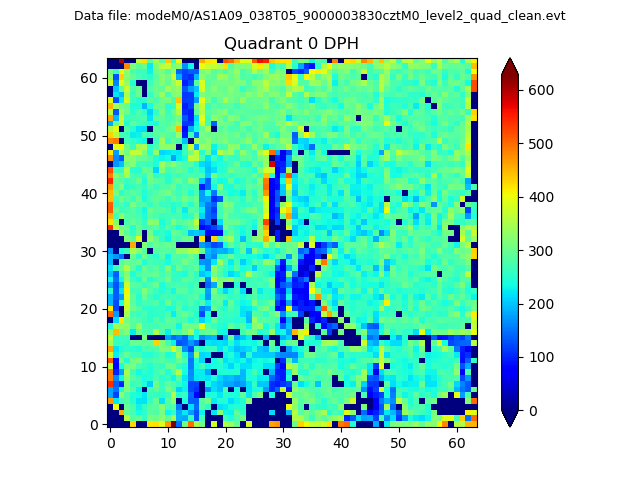 |
 |
Quadrant B |
|---|---|---|---|
| Quadrant D |  |
 |
Quadrant C |
| Plot type | Count rate plots | Images |
|---|---|---|
| Comparison with Poisson distribution Blue bars denote a histogram of data divided into 1 sec bins. Red curve is a Poisson curve with rate = median count rate of data. |
 |
 |
| Quadrant-wise count rates Data is divided into 100 sec bins |
 |
|
| Module-wise count rates for Quadrant A Data is divided into 100 sec bins |
 |
 |
| Module-wise count rates for Quadrant B Data is divided into 100 sec bins |
 |
 |
| Module-wise count rates for Quadrant C Data is divided into 100 sec bins |
 |
 |
| Module-wise count rates for Quadrant D Data is divided into 100 sec bins |
 |
 |
| Parameter | Plot |
|---|---|
| CZT HV Monitor | 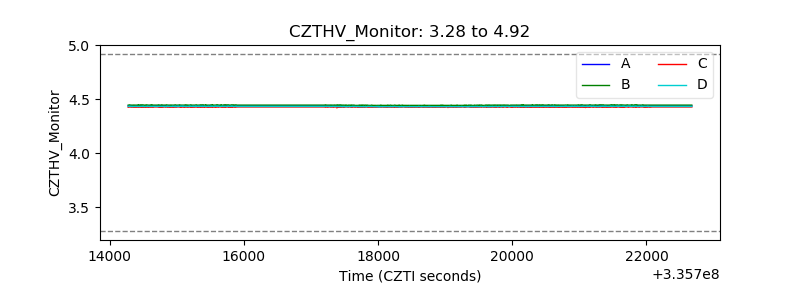 |
| D_VDD |  |
| Temperature 1 | 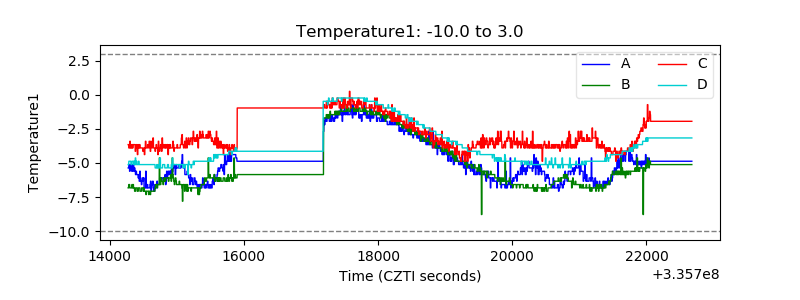 |
| Veto HV Monitor |  |
| Veto LLD | 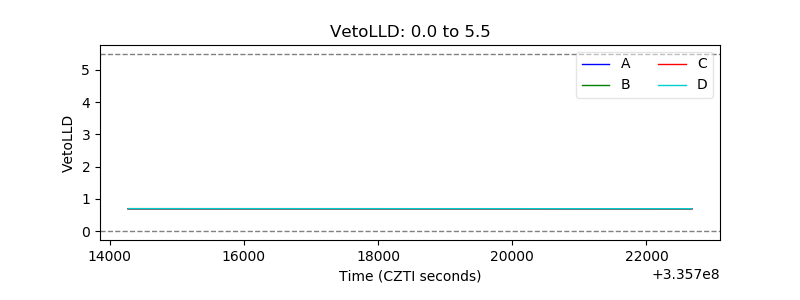 |
| Alpha Counter |  |
| _CPM_Rate | 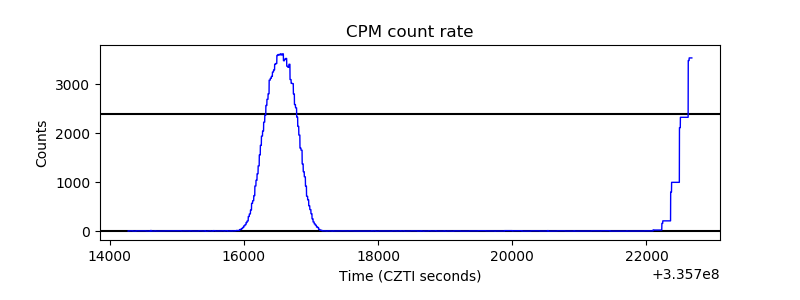 |
| CZT Counter | 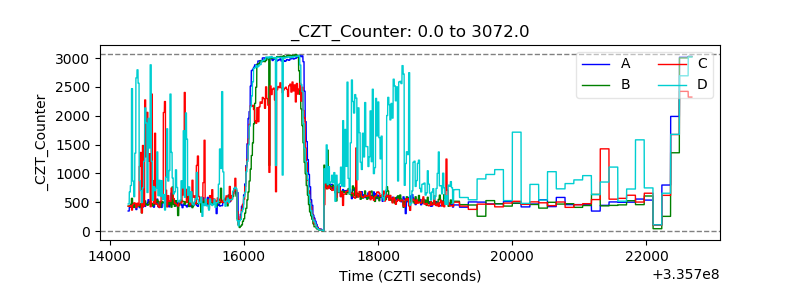 |
| +2.5 Volts monitor |  |
| +5 Volts monitor | 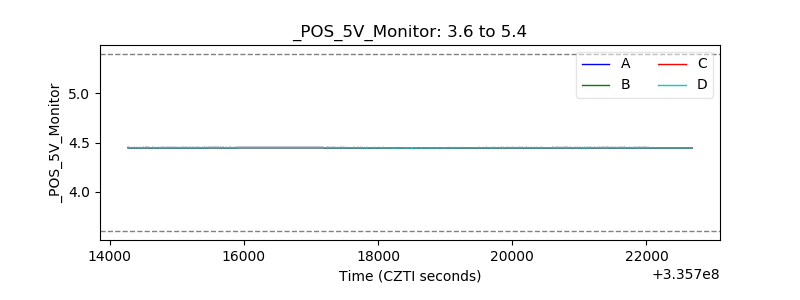 |
| _ROLL_ROT |  |
| _Roll_DEC |  |
| _Roll_RA |  |
| Veto Counter | 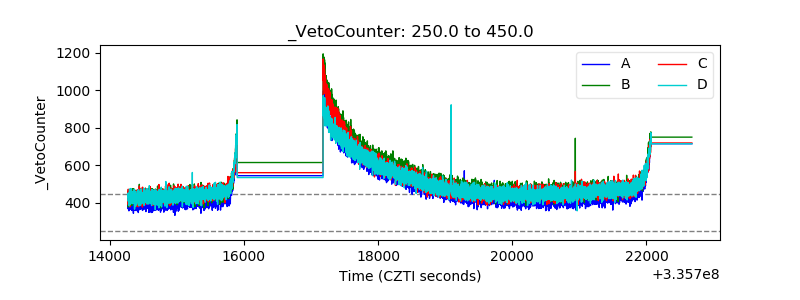 |