| Param | Original file | Final file |
|---|---|---|
| Filename | modeM0/AS1A07_146T01_9000003828cztM0_level2_bc.evt | modeM0/AS1A07_146T01_9000003828cztM0_level2_quad_clean.evt |
| Size (bytes) | 894,208,320 | 278,265,600 |
| Size | 852.8 MB | 265.4 MB |
| Events in quadrant A | 5,068,019 | 1,727,464 |
| Events in quadrant B | 5,204,941 | 1,761,495 |
| Events in quadrant C | 5,383,274 | 1,663,539 |
| Events in quadrant D | 9,776,629 | 1,616,331 |
| Mode M0 | |||
|---|---|---|---|
| Quadrant | BADHDUFLAG | Total packets | Discarded packets |
| A | 0 | 49938 | 0 |
| B | 0 | 50333 | 0 |
| C | 0 | 51351 | 0 |
| D | 0 | 65404 | 0 |
| Mode SS | |||
|---|---|---|---|
| Quadrant | BADHDUFLAG | Total packets | Discarded packets |
| A | 0 | 492 | 0 |
| B | 0 | 492 | 0 |
| C | 0 | 492 | 0 |
| D | 0 | 492 | 0 |
| Mode M9 | |||
|---|---|---|---|
| Quadrant | BADHDUFLAG | Total packets | Discarded packets |
| A | 0 | 42 | 0 |
| B | 0 | 42 | 0 |
| C | 0 | 42 | 0 |
| D | 0 | 42 | 0 |
| Quadrant | Total seconds | Saturated seconds | Saturation percentage |
|---|---|---|---|
| A | 24109 | 235 | 0.974740% |
| B | 24109 | 265 | 1.099175% |
| C | 24109 | 316 | 1.310714% |
| D | 24109 | 1334 | 5.533203% |
Noise dominated data is calculated using 1-second bins in cleaned event files. If a bin has >2000 counts, and if more than 50% of those come from <1% of pixels, then it is considered to be noise-dominated and hence unusable.
| Quadrant | # 1 sec bins | Bins with >0 counts | Bins with >2000 counts | High rate bins dominated by noise | Noise dominated (total time) | Noise dominated (detector-on time) | Marked lightcurve |
|---|---|---|---|---|---|---|---|
| A | 28299 | 24106 | 0 | 0 | 0.00% | 0.00% | 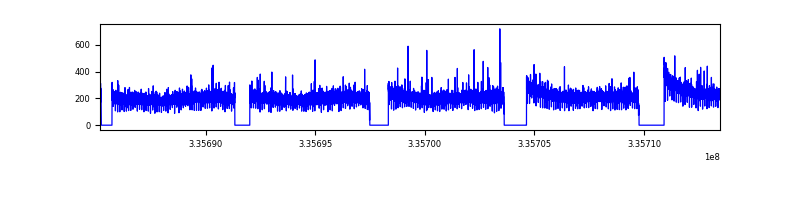 |
| B | 28299 | 24107 | 0 | 0 | 0.00% | 0.00% | 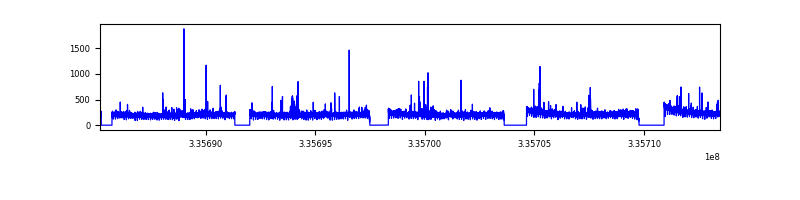 |
| C | 28299 | 24105 | 0 | 0 | 0.00% | 0.00% |  |
| D | 28299 | 24106 | 519 | 519 | 1.83% | 2.15% |  |
Top three noisy pixels from each quadrant. If the there are fewer than three noisy pixels in the level2.evt file, extra rows are filled as -1
| Pixel properties | Quadrant properties | ||||||
|---|---|---|---|---|---|---|---|
| Quadrant | DetID | PixID | Counts | Sigma | Mean | Median | Sigma |
| A | 13 | 254 | 34915 | 118.77 | 1311 | 1286 | 283.1 |
| A | 0 | 226 | 8172 | 24.32 | 1311 | 1286 | 283.1 |
| A | 12 | 194 | 8046 | 23.88 | 1311 | 1286 | 283.1 |
| B | 0 | 190 | 49474 | 195.48 | 1315 | 1283 | 246.5 |
| B | 0 | 229 | 26804 | 103.52 | 1315 | 1283 | 246.5 |
| B | 15 | 33 | 25539 | 98.39 | 1315 | 1283 | 246.5 |
| C | 3 | 233 | 365301 | 1242.44 | 1252 | 1246 | 293.0 |
| C | 4 | 254 | 88140 | 296.55 | 1252 | 1246 | 293.0 |
| C | 14 | 176 | 72693 | 243.83 | 1252 | 1246 | 293.0 |
| D | 1 | 52 | 2537119 | 8709.69 | 1255 | 1219 | 291.2 |
| D | 7 | 80 | 1927676 | 6616.52 | 1255 | 1219 | 291.2 |
| D | 12 | 233 | 255078 | 871.89 | 1255 | 1219 | 291.2 |
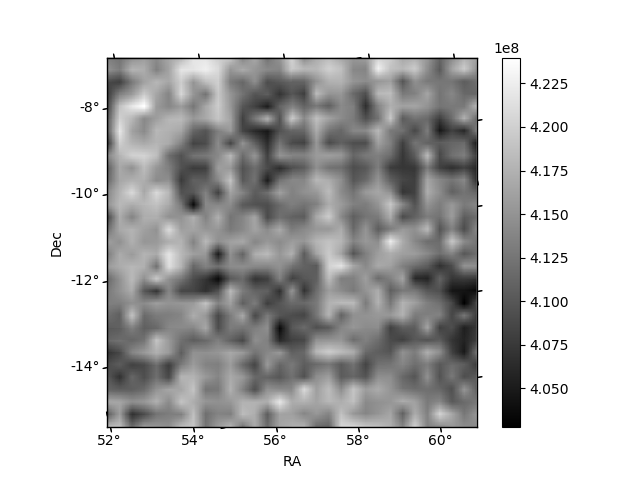
Histogram calculated using DETX and DETY for each event in the final _common_clean file
| Quadrant A | 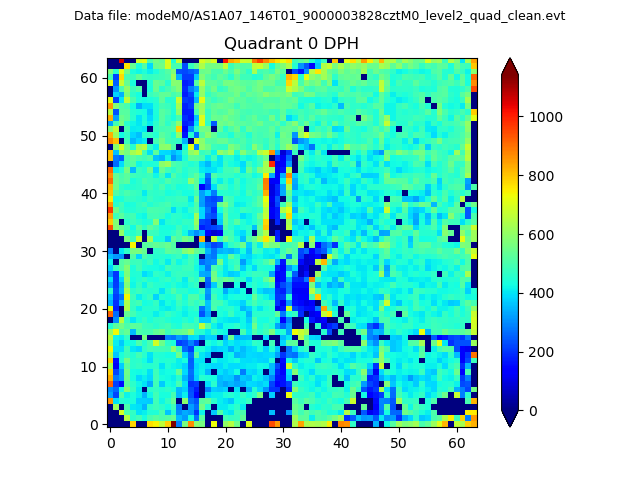 |
 |
Quadrant B |
|---|---|---|---|
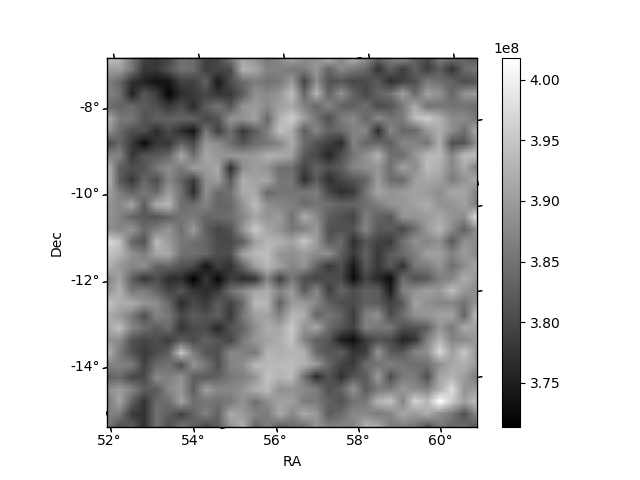
| Quadrant D |  |
 |
Quadrant C |
| Plot type | Count rate plots | Images |
|---|---|---|
| Comparison with Poisson distribution Blue bars denote a histogram of data divided into 1 sec bins. Red curve is a Poisson curve with rate = median count rate of data. |
 |
 |
| Quadrant-wise count rates Data is divided into 100 sec bins |
 |
|
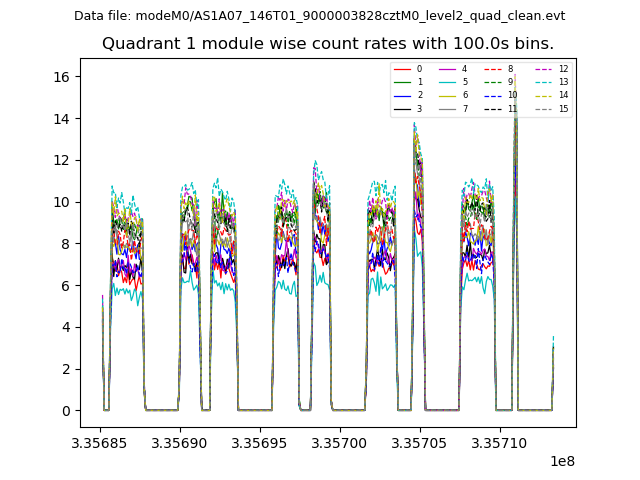
| Module-wise count rates for Quadrant A Data is divided into 100 sec bins |
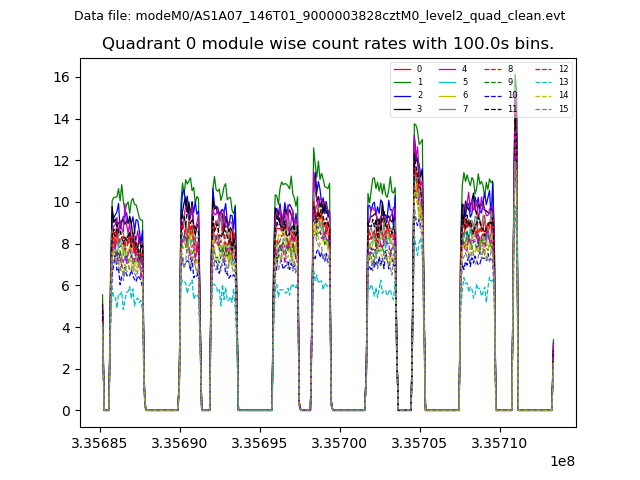 |
 |
| Module-wise count rates for Quadrant B Data is divided into 100 sec bins |
 |
 |
| Module-wise count rates for Quadrant C Data is divided into 100 sec bins |
 |
 |
| Module-wise count rates for Quadrant D Data is divided into 100 sec bins |
 |
 |
| Parameter | Plot |
|---|---|
| CZT HV Monitor |  |
| D_VDD |  |
| Temperature 1 | 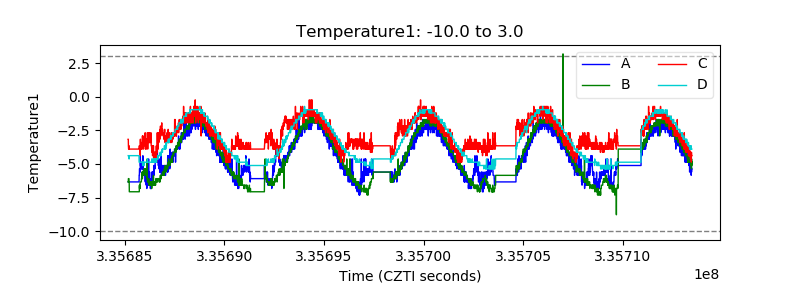 |
| Veto HV Monitor |  |
| Veto LLD |  |
| Alpha Counter |  |
| _CPM_Rate |  |
| CZT Counter |  |
| +2.5 Volts monitor |  |
| +5 Volts monitor | 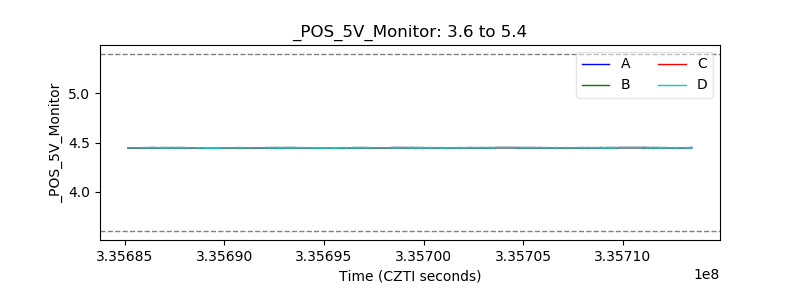 |
| _ROLL_ROT |  |
| _Roll_DEC |  |
| _Roll_RA | 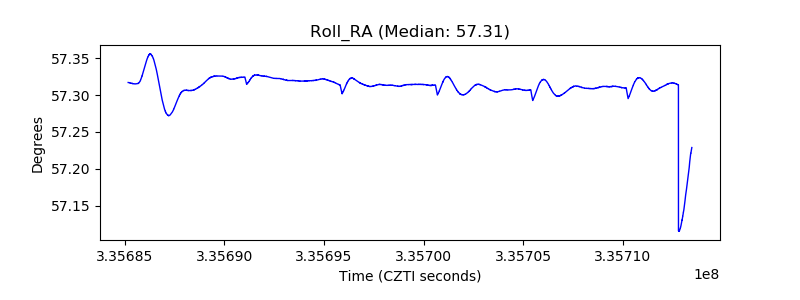 |
| Veto Counter |  |