| Param | Original file | Final file |
|---|---|---|
| Filename | modeM0/AS1A09_104T02_9000003826cztM0_level2_bc.evt | modeM0/AS1A09_104T02_9000003826cztM0_level2_quad_clean.evt |
| Size (bytes) | 4,763,957,760 | 1,359,120,960 |
| Size | 4.4 GB | 1.3 GB |
| Events in quadrant A | 22,487,407 | 8,958,335 |
| Events in quadrant B | 23,209,177 | 9,071,049 |
| Events in quadrant C | 26,671,695 | 8,557,585 |
| Events in quadrant D | 64,808,490 | 7,426,931 |
| Mode SS | |||
|---|---|---|---|
| Quadrant | BADHDUFLAG | Total packets | Discarded packets |
| A | 0 | 2122 | 0 |
| B | 0 | 2122 | 0 |
| C | 0 | 2018 | 0 |
| D | 0 | 2122 | 0 |
| Mode M0 | |||
|---|---|---|---|
| Quadrant | BADHDUFLAG | Total packets | Discarded packets |
| A | 0 | 219357 | 0 |
| B | 0 | 221604 | 0 |
| C | 0 | 237563 | 0 |
| D | 0 | 385648 | 0 |
| Mode M9 | |||
|---|---|---|---|
| Quadrant | BADHDUFLAG | Total packets | Discarded packets |
| A | 0 | 161 | 0 |
| B | 0 | 161 | 0 |
| C | 0 | 161 | 0 |
| D | 0 | 161 | 0 |
| Quadrant | Total seconds | Saturated seconds | Saturation percentage |
|---|---|---|---|
| A | 104401 | 1087 | 1.041178% |
| B | 104401 | 1456 | 1.394623% |
| C | 104401 | 2769 | 2.652273% |
| D | 104401 | 18437 | 17.659793% |
Noise dominated data is calculated using 1-second bins in cleaned event files. If a bin has >2000 counts, and if more than 50% of those come from <1% of pixels, then it is considered to be noise-dominated and hence unusable.
| Quadrant | # 1 sec bins | Bins with >0 counts | Bins with >2000 counts | High rate bins dominated by noise | Noise dominated (total time) | Noise dominated (detector-on time) | Marked lightcurve |
|---|---|---|---|---|---|---|---|
| A | 120187 | 104399 | 2 | 2 | 0.00% | 0.00% | 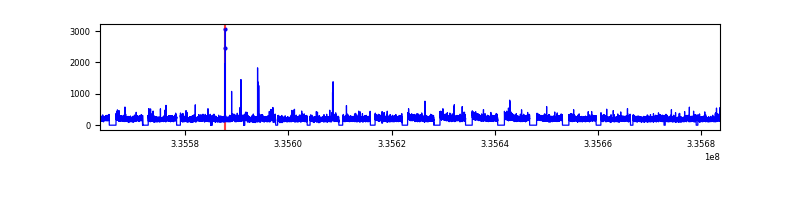 |
| B | 120187 | 104393 | 10 | 10 | 0.01% | 0.01% |  |
| C | 120187 | 104399 | 77 | 77 | 0.06% | 0.07% |  |
| D | 120187 | 104394 | 5039 | 5039 | 4.19% | 4.83% |  |
Top three noisy pixels from each quadrant. If the there are fewer than three noisy pixels in the level2.evt file, extra rows are filled as -1
| Pixel properties | Quadrant properties | ||||||
|---|---|---|---|---|---|---|---|
| Quadrant | DetID | PixID | Counts | Sigma | Mean | Median | Sigma |
| A | 6 | 16 | 214100 | 168.0 | 5765 | 5661 | 1240.7 |
| A | 13 | 254 | 158755 | 123.39 | 5765 | 5661 | 1240.7 |
| A | 0 | 226 | 36817 | 25.11 | 5765 | 5661 | 1240.7 |
| B | 0 | 190 | 234380 | 209.66 | 5802 | 5654 | 1090.9 |
| B | 5 | 172 | 209655 | 187.0 | 5802 | 5654 | 1090.9 |
| B | 0 | 230 | 149255 | 131.63 | 5802 | 5654 | 1090.9 |
| C | 2 | 16 | 2682351 | 2097.02 | 5479 | 5471 | 1276.5 |
| C | 3 | 233 | 2143035 | 1674.53 | 5479 | 5471 | 1276.5 |
| C | 4 | 254 | 688295 | 534.91 | 5479 | 5471 | 1276.5 |
| D | 7 | 80 | 27646449 | 23605.95 | 5095 | 4958 | 1171.0 |
| D | 1 | 52 | 12456492 | 10633.66 | 5095 | 4958 | 1171.0 |
| D | 12 | 233 | 2707406 | 2307.9 | 5095 | 4958 | 1171.0 |
Histogram calculated using DETX and DETY for each event in the final _common_clean file
| Quadrant A |  |
 |
Quadrant B |
|---|---|---|---|
| Quadrant D |  |
 |
Quadrant C |
| Plot type | Count rate plots | Images |
|---|---|---|
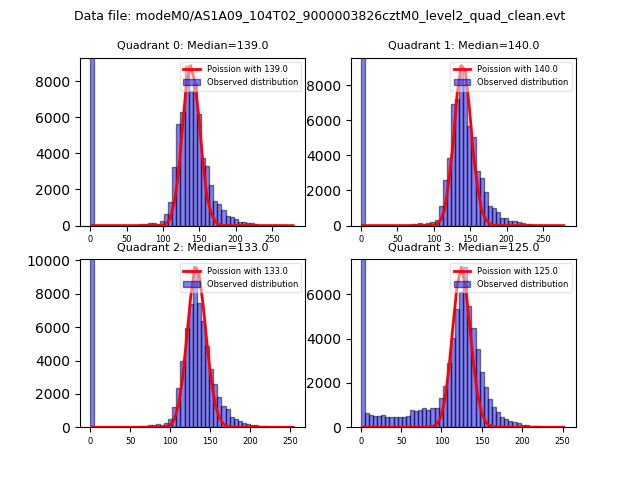
| Comparison with Poisson distribution Blue bars denote a histogram of data divided into 1 sec bins. Red curve is a Poisson curve with rate = median count rate of data. |
 |
 |
| Quadrant-wise count rates Data is divided into 100 sec bins |
 |
|
| Module-wise count rates for Quadrant A Data is divided into 100 sec bins |
 |
 |
| Module-wise count rates for Quadrant B Data is divided into 100 sec bins |
 |
 |
| Module-wise count rates for Quadrant C Data is divided into 100 sec bins |
 |
 |
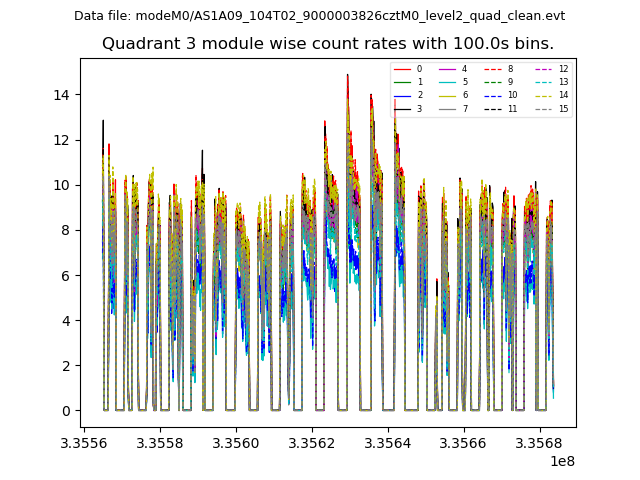
| Module-wise count rates for Quadrant D Data is divided into 100 sec bins |
 |
 |
| Parameter | Plot |
|---|---|
| CZT HV Monitor |  |
| D_VDD |  |
| Temperature 1 | 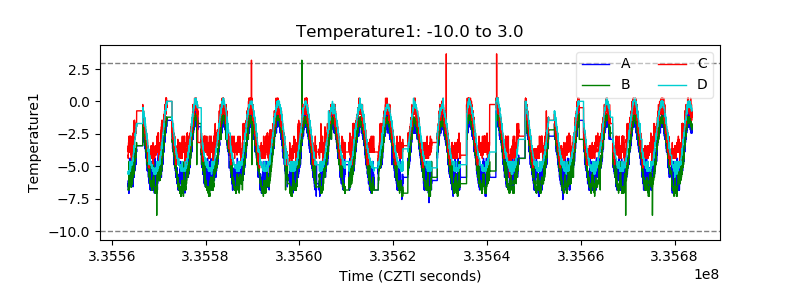 |
| Veto HV Monitor |  |
| Veto LLD | 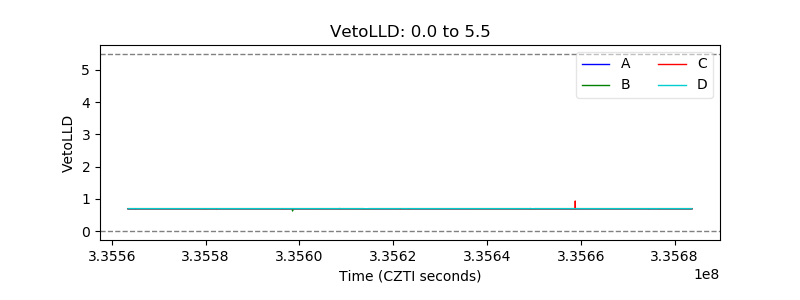 |
| Alpha Counter | 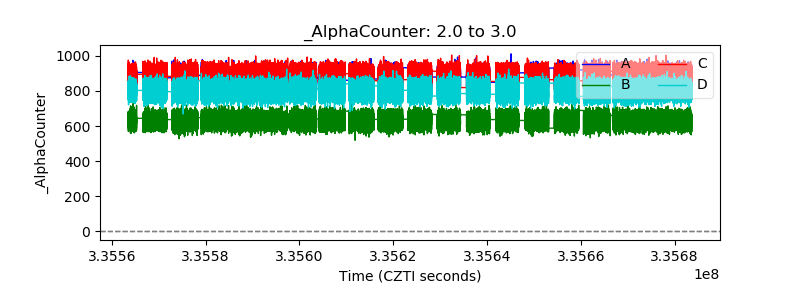 |
| _CPM_Rate |  |
| CZT Counter |  |
| +2.5 Volts monitor |  |
| +5 Volts monitor | 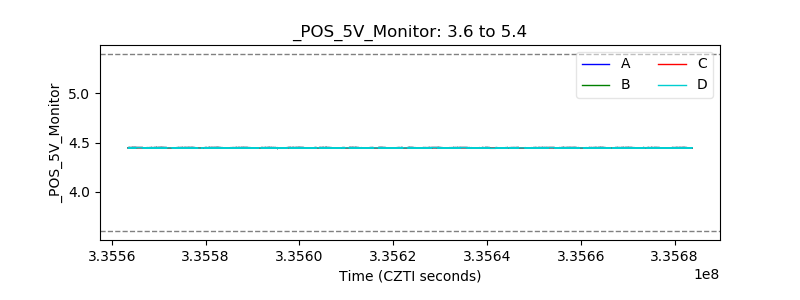 |
| _ROLL_ROT |  |
| _Roll_DEC |  |
| _Roll_RA |  |
| Veto Counter | 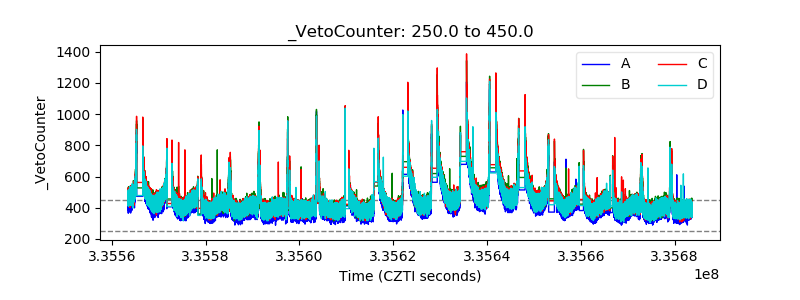 |