| Param | Original file | Final file |
|---|---|---|
| Filename | modeM0/AS1A09_056T01_9000003824cztM0_level2_bc.evt | modeM0/AS1A09_056T01_9000003824cztM0_level2_quad_clean.evt |
| Size (bytes) | 1,564,476,480 | 600,719,040 |
| Size | 1.5 GB | 572.9 MB |
| Events in quadrant A | 9,216,726 | 3,987,071 |
| Events in quadrant B | 9,487,442 | 4,035,552 |
| Events in quadrant C | 10,477,914 | 3,863,566 |
| Events in quadrant D | 15,589,348 | 3,685,096 |
| Mode SS | |||
|---|---|---|---|
| Quadrant | BADHDUFLAG | Total packets | Discarded packets |
| A | 0 | 772 | 0 |
| B | 0 | 786 | 0 |
| C | 0 | 784 | 0 |
| D | 0 | 788 | 0 |
| Mode M9 | |||
|---|---|---|---|
| Quadrant | BADHDUFLAG | Total packets | Discarded packets |
| A | 0 | 96 | 0 |
| B | 0 | 96 | 0 |
| C | 0 | 108 | 0 |
| D | 0 | 98 | 0 |
| Mode M0 | |||
|---|---|---|---|
| Quadrant | BADHDUFLAG | Total packets | Discarded packets |
| A | 0 | 82899 | 0 |
| B | 0 | 83793 | 0 |
| C | 0 | 88853 | 0 |
| D | 0 | 105061 | 0 |
| Quadrant | Total seconds | Saturated seconds | Saturation percentage |
|---|---|---|---|
| A | 38370 | 392 | 1.021631% |
| B | 38126 | 448 | 1.175051% |
| C | 38374 | 1020 | 2.658050% |
| D | 37951 | 2373 | 6.252800% |
Noise dominated data is calculated using 1-second bins in cleaned event files. If a bin has >2000 counts, and if more than 50% of those come from <1% of pixels, then it is considered to be noise-dominated and hence unusable.
| Quadrant | # 1 sec bins | Bins with >0 counts | Bins with >2000 counts | High rate bins dominated by noise | Noise dominated (total time) | Noise dominated (detector-on time) | Marked lightcurve |
|---|---|---|---|---|---|---|---|
| A | 52289 | 38281 | 23 | 23 | 0.04% | 0.06% | 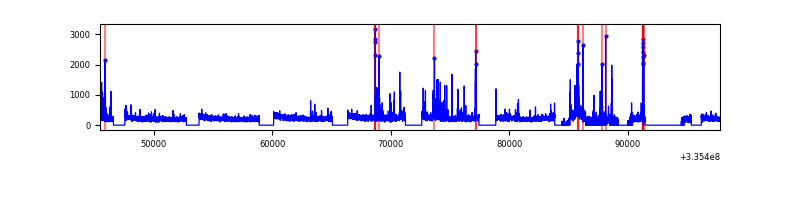 |
| B | 52289 | 38074 | 0 | 0 | 0.00% | 0.00% |  |
| C | 52289 | 38289 | 56 | 56 | 0.11% | 0.15% |  |
| D | 52289 | 37966 | 634 | 634 | 1.21% | 1.67% |  |
Top three noisy pixels from each quadrant. If the there are fewer than three noisy pixels in the level2.evt file, extra rows are filled as -1
| Pixel properties | Quadrant properties | ||||||
|---|---|---|---|---|---|---|---|
| Quadrant | DetID | PixID | Counts | Sigma | Mean | Median | Sigma |
| A | 0 | 13 | 478342 | 998.96 | 2243 | 2211 | 476.6 |
| A | 13 | 254 | 54558 | 109.83 | 2243 | 2211 | 476.6 |
| A | 12 | 189 | 38164 | 75.43 | 2243 | 2211 | 476.6 |
| B | 0 | 189 | 505337 | 1197.44 | 2255 | 2210 | 420.2 |
| B | 0 | 190 | 134272 | 314.31 | 2255 | 2210 | 420.2 |
| B | 10 | 245 | 93889 | 218.19 | 2255 | 2210 | 420.2 |
| C | 4 | 254 | 1387625 | 2702.09 | 2175 | 2179 | 512.7 |
| C | 3 | 233 | 528388 | 1026.29 | 2175 | 2179 | 512.7 |
| C | 2 | 16 | 148001 | 284.4 | 2175 | 2179 | 512.7 |
| D | 7 | 80 | 3168643 | 6417.12 | 2127 | 2080 | 493.5 |
| D | 1 | 52 | 2183752 | 4421.21 | 2127 | 2080 | 493.5 |
| D | 11 | 176 | 952687 | 1926.43 | 2127 | 2080 | 493.5 |
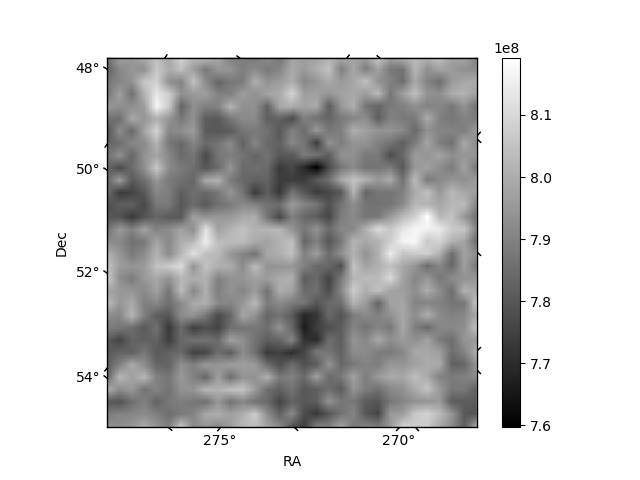
Histogram calculated using DETX and DETY for each event in the final _common_clean file
| Quadrant A |  |
 |
Quadrant B |
|---|---|---|---|
| Quadrant D |  |
 |
Quadrant C |
| Plot type | Count rate plots | Images |
|---|---|---|
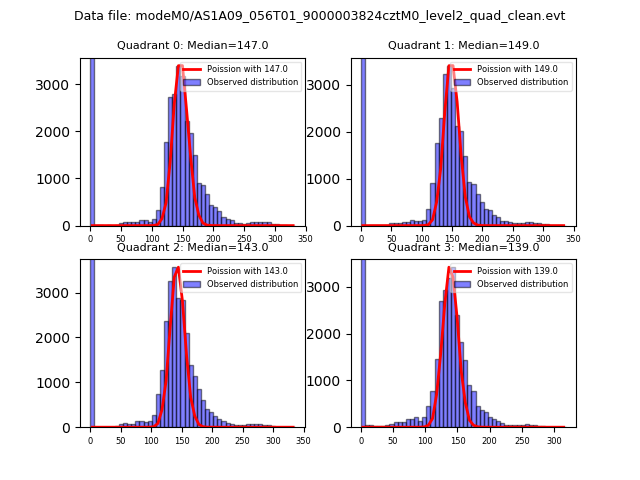
| Comparison with Poisson distribution Blue bars denote a histogram of data divided into 1 sec bins. Red curve is a Poisson curve with rate = median count rate of data. |
 |
 |
| Quadrant-wise count rates Data is divided into 100 sec bins |
 |
|
| Module-wise count rates for Quadrant A Data is divided into 100 sec bins |
 |
 |
| Module-wise count rates for Quadrant B Data is divided into 100 sec bins |
 |
 |
| Module-wise count rates for Quadrant C Data is divided into 100 sec bins |
 |
 |
| Module-wise count rates for Quadrant D Data is divided into 100 sec bins |
 |
 |
| Parameter | Plot |
|---|---|
| CZT HV Monitor |  |
| D_VDD |  |
| Temperature 1 | 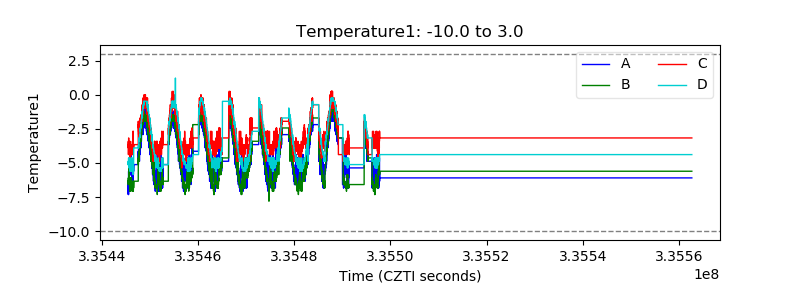 |
| Veto HV Monitor |  |
| Veto LLD |  |
| Alpha Counter |  |
| _CPM_Rate |  |
| CZT Counter |  |
| +2.5 Volts monitor |  |
| +5 Volts monitor |  |
| _ROLL_ROT |  |
| _Roll_DEC |  |
| _Roll_RA | 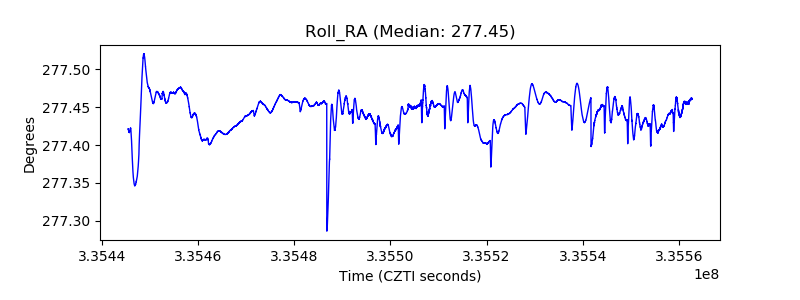 |
| Veto Counter |  |