| Param | Original file | Final file |
|---|---|---|
| Filename | modeM0/AS1A09_108T02_9000003822cztM0_level2_bc.evt | modeM0/AS1A09_108T02_9000003822cztM0_level2_quad_clean.evt |
| Size (bytes) | 2,345,852,160 | 845,544,960 |
| Size | 2.2 GB | 806.4 MB |
| Events in quadrant A | 13,373,760 | 5,420,086 |
| Events in quadrant B | 13,227,154 | 5,574,123 |
| Events in quadrant C | 15,085,531 | 5,367,136 |
| Events in quadrant D | 25,277,396 | 5,142,548 |
| Mode M9 | |||
|---|---|---|---|
| Quadrant | BADHDUFLAG | Total packets | Discarded packets |
| A | 0 | 94 | 0 |
| B | 0 | 94 | 0 |
| C | 0 | 94 | 0 |
| D | 0 | 94 | 0 |
| Mode M0 | |||
|---|---|---|---|
| Quadrant | BADHDUFLAG | Total packets | Discarded packets |
| A | 0 | 126965 | 0 |
| B | 0 | 126487 | 0 |
| C | 0 | 135400 | 0 |
| D | 0 | 167959 | 0 |
| Mode SS | |||
|---|---|---|---|
| Quadrant | BADHDUFLAG | Total packets | Discarded packets |
| A | 0 | 1220 | 0 |
| B | 0 | 1220 | 0 |
| C | 0 | 1220 | 0 |
| D | 0 | 1220 | 0 |
| Quadrant | Total seconds | Saturated seconds | Saturation percentage |
|---|---|---|---|
| A | 59878 | 618 | 1.032099% |
| B | 59878 | 734 | 1.225826% |
| C | 59878 | 1489 | 2.486723% |
| D | 59878 | 4031 | 6.732022% |
Noise dominated data is calculated using 1-second bins in cleaned event files. If a bin has >2000 counts, and if more than 50% of those come from <1% of pixels, then it is considered to be noise-dominated and hence unusable.
| Quadrant | # 1 sec bins | Bins with >0 counts | Bins with >2000 counts | High rate bins dominated by noise | Noise dominated (total time) | Noise dominated (detector-on time) | Marked lightcurve |
|---|---|---|---|---|---|---|---|
| A | 69268 | 59878 | 26 | 26 | 0.04% | 0.04% | 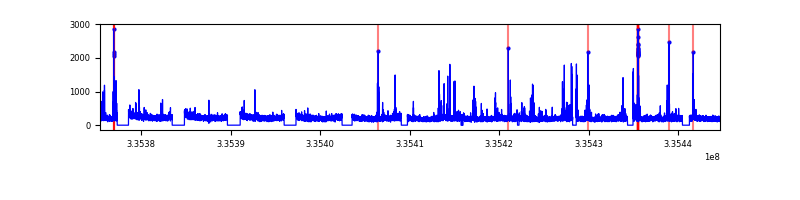 |
| B | 69268 | 59875 | 0 | 0 | 0.00% | 0.00% |  |
| C | 69268 | 59876 | 73 | 73 | 0.11% | 0.12% |  |
| D | 69268 | 59876 | 1207 | 1207 | 1.74% | 2.02% |  |
Top three noisy pixels from each quadrant. If the there are fewer than three noisy pixels in the level2.evt file, extra rows are filled as -1
| Pixel properties | Quadrant properties | ||||||
|---|---|---|---|---|---|---|---|
| Quadrant | DetID | PixID | Counts | Sigma | Mean | Median | Sigma |
| A | 0 | 13 | 559723 | 787.54 | 3280 | 3225 | 706.6 |
| A | 6 | 16 | 119369 | 164.36 | 3280 | 3225 | 706.6 |
| A | 13 | 254 | 86036 | 117.19 | 3280 | 3225 | 706.6 |
| B | 0 | 244 | 129292 | 203.07 | 3343 | 3272 | 620.6 |
| B | 0 | 229 | 64510 | 98.68 | 3343 | 3272 | 620.6 |
| B | 5 | 172 | 57894 | 88.02 | 3343 | 3272 | 620.6 |
| C | 4 | 254 | 1093469 | 1446.75 | 3212 | 3205 | 753.6 |
| C | 3 | 233 | 752278 | 994.0 | 3212 | 3205 | 753.6 |
| C | 2 | 16 | 574746 | 758.42 | 3212 | 3205 | 753.6 |
| D | 1 | 52 | 6737941 | 9277.85 | 3168 | 3088 | 725.9 |
| D | 11 | 176 | 3296198 | 4536.55 | 3168 | 3088 | 725.9 |
| D | 7 | 80 | 1572479 | 2161.97 | 3168 | 3088 | 725.9 |
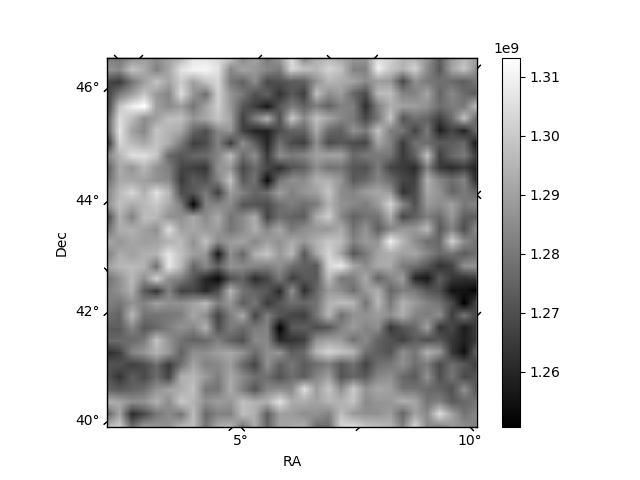
Histogram calculated using DETX and DETY for each event in the final _common_clean file
| Quadrant A |  |
 |
Quadrant B |
|---|---|---|---|
| Quadrant D |  |
 |
Quadrant C |
| Plot type | Count rate plots | Images |
|---|---|---|
| Comparison with Poisson distribution Blue bars denote a histogram of data divided into 1 sec bins. Red curve is a Poisson curve with rate = median count rate of data. |
 |
 |
| Quadrant-wise count rates Data is divided into 100 sec bins |
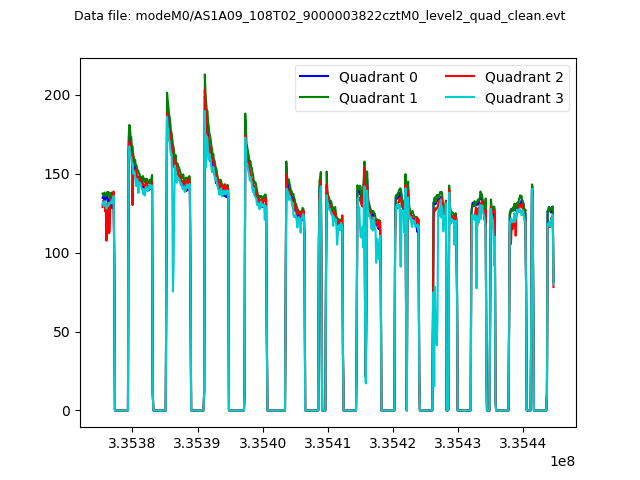 |
|
| Module-wise count rates for Quadrant A Data is divided into 100 sec bins |
 |
 |
| Module-wise count rates for Quadrant B Data is divided into 100 sec bins |
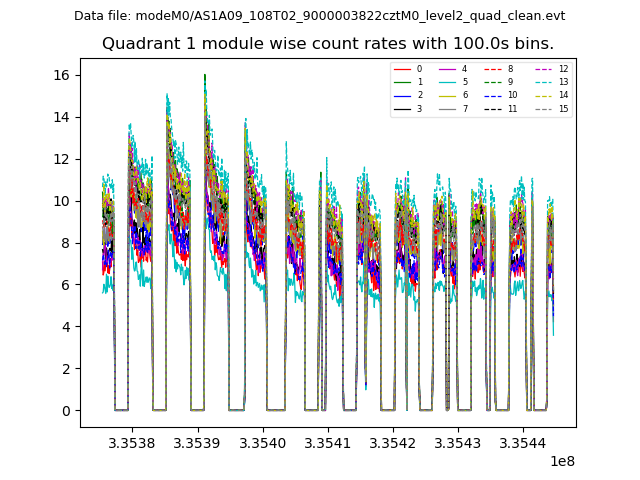 |
 |
| Module-wise count rates for Quadrant C Data is divided into 100 sec bins |
 |
 |
| Module-wise count rates for Quadrant D Data is divided into 100 sec bins |
 |
 |
| Parameter | Plot |
|---|---|
| CZT HV Monitor |  |
| D_VDD |  |
| Temperature 1 |  |
| Veto HV Monitor |  |
| Veto LLD | 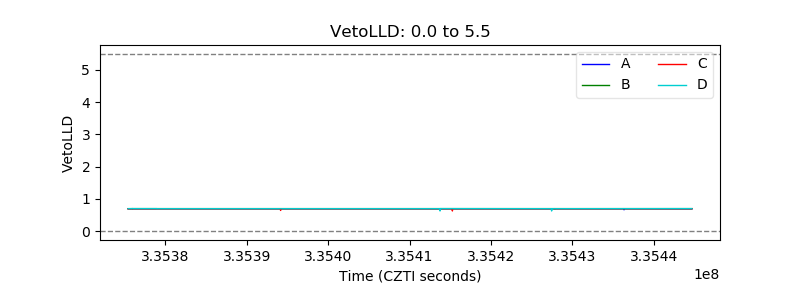 |
| Alpha Counter |  |
| _CPM_Rate |  |
| CZT Counter |  |
| +2.5 Volts monitor |  |
| +5 Volts monitor |  |
| _ROLL_ROT |  |
| _Roll_DEC |  |
| _Roll_RA |  |
| Veto Counter |  |