| Param | Original file | Final file |
|---|---|---|
| Filename | modeM0/AS1A09_127T02_9000003818cztM0_level2_bc.evt | modeM0/AS1A09_127T02_9000003818cztM0_level2_quad_clean.evt |
| Size (bytes) | 1,675,313,280 | 545,742,720 |
| Size | 1.6 GB | 520.5 MB |
| Events in quadrant A | 8,432,308 | 3,565,859 |
| Events in quadrant B | 10,262,722 | 3,565,921 |
| Events in quadrant C | 12,309,415 | 3,401,973 |
| Events in quadrant D | 17,065,473 | 3,309,929 |
| Mode M9 | |||
|---|---|---|---|
| Quadrant | BADHDUFLAG | Total packets | Discarded packets |
| A | 0 | 76 | 0 |
| B | 0 | 76 | 0 |
| C | 0 | 76 | 0 |
| D | 0 | 76 | 0 |
| Mode M0 | |||
|---|---|---|---|
| Quadrant | BADHDUFLAG | Total packets | Discarded packets |
| A | 0 | 81631 | 0 |
| B | 0 | 90069 | 0 |
| C | 0 | 97309 | 0 |
| D | 0 | 114858 | 0 |
| Mode SS | |||
|---|---|---|---|
| Quadrant | BADHDUFLAG | Total packets | Discarded packets |
| A | 0 | 798 | 0 |
| B | 0 | 798 | 0 |
| C | 0 | 798 | 0 |
| D | 0 | 798 | 0 |
| Quadrant | Total seconds | Saturated seconds | Saturation percentage |
|---|---|---|---|
| A | 39116 | 398 | 1.017486% |
| B | 39116 | 1172 | 2.996216% |
| C | 39116 | 1755 | 4.486655% |
| D | 39116 | 2553 | 6.526741% |
Noise dominated data is calculated using 1-second bins in cleaned event files. If a bin has >2000 counts, and if more than 50% of those come from <1% of pixels, then it is considered to be noise-dominated and hence unusable.
| Quadrant | # 1 sec bins | Bins with >0 counts | Bins with >2000 counts | High rate bins dominated by noise | Noise dominated (total time) | Noise dominated (detector-on time) | Marked lightcurve |
|---|---|---|---|---|---|---|---|
| A | 46761 | 39116 | 14 | 14 | 0.03% | 0.04% |  |
| B | 46761 | 39116 | 60 | 60 | 0.13% | 0.15% |  |
| C | 46761 | 39116 | 100 | 100 | 0.21% | 0.26% |  |
| D | 46761 | 39117 | 339 | 339 | 0.72% | 0.87% |  |
Top three noisy pixels from each quadrant. If the there are fewer than three noisy pixels in the level2.evt file, extra rows are filled as -1
| Pixel properties | Quadrant properties | ||||||
|---|---|---|---|---|---|---|---|
| Quadrant | DetID | PixID | Counts | Sigma | Mean | Median | Sigma |
| A | 15 | 192 | 96975 | 207.05 | 2133 | 2101 | 458.2 |
| A | 13 | 254 | 66794 | 141.19 | 2133 | 2101 | 458.2 |
| A | 0 | 13 | 63205 | 133.35 | 2133 | 2101 | 458.2 |
| B | 5 | 172 | 1224014 | 3046.01 | 2141 | 2096 | 401.2 |
| B | 0 | 244 | 357720 | 886.5 | 2141 | 2096 | 401.2 |
| B | 0 | 230 | 90588 | 220.59 | 2141 | 2096 | 401.2 |
| C | 2 | 16 | 2164243 | 4416.2 | 2047 | 2042 | 489.6 |
| C | 3 | 233 | 2088268 | 4261.03 | 2047 | 2042 | 489.6 |
| C | 4 | 254 | 75197 | 149.42 | 2047 | 2042 | 489.6 |
| D | 1 | 52 | 7075854 | 14994.73 | 2048 | 1994 | 471.8 |
| D | 12 | 233 | 664664 | 1404.69 | 2048 | 1994 | 471.8 |
| D | 7 | 80 | 571394 | 1206.98 | 2048 | 1994 | 471.8 |
Histogram calculated using DETX and DETY for each event in the final _common_clean file
| Quadrant A |  |
 |
Quadrant B |
|---|---|---|---|
| Quadrant D |  |
 |
Quadrant C |
| Plot type | Count rate plots | Images |
|---|---|---|
| Comparison with Poisson distribution Blue bars denote a histogram of data divided into 1 sec bins. Red curve is a Poisson curve with rate = median count rate of data. |
 |
 |
| Quadrant-wise count rates Data is divided into 100 sec bins |
 |
|
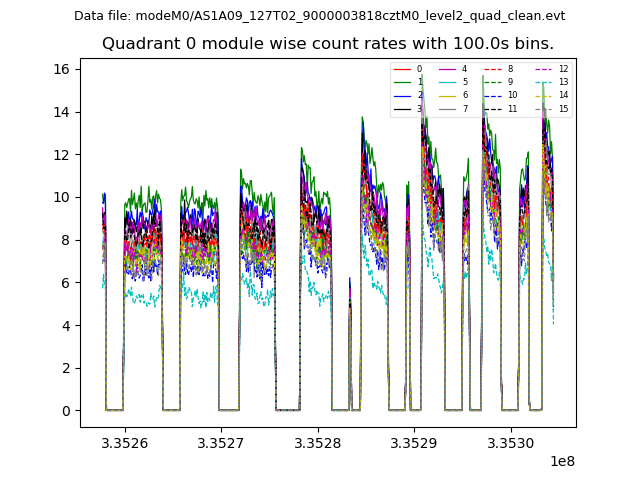
| Module-wise count rates for Quadrant A Data is divided into 100 sec bins |
 |
 |
| Module-wise count rates for Quadrant B Data is divided into 100 sec bins |
 |
 |
| Module-wise count rates for Quadrant C Data is divided into 100 sec bins |
 |
 |
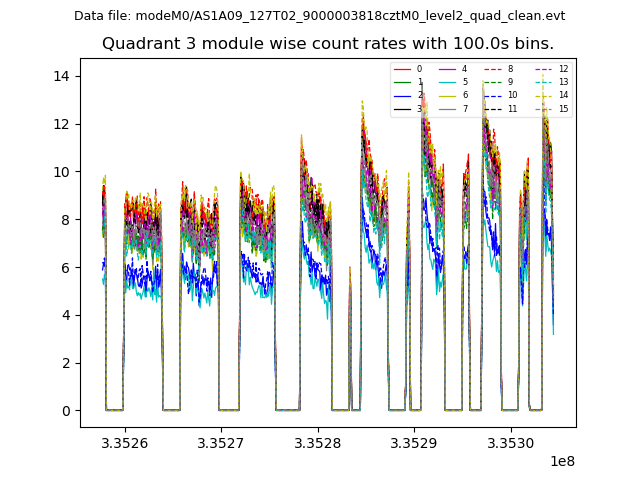
| Module-wise count rates for Quadrant D Data is divided into 100 sec bins |
 |
 |
| Parameter | Plot |
|---|---|
| CZT HV Monitor |  |
| D_VDD | 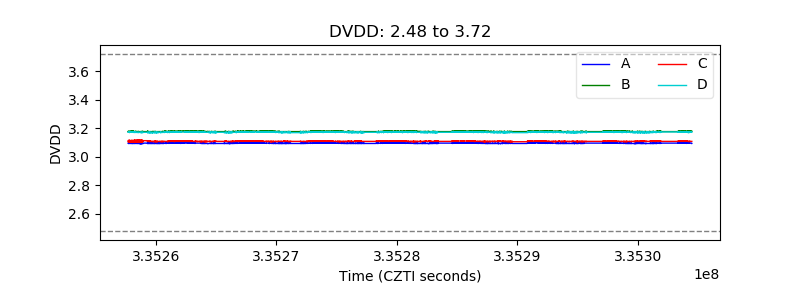 |
| Temperature 1 |  |
| Veto HV Monitor |  |
| Veto LLD | 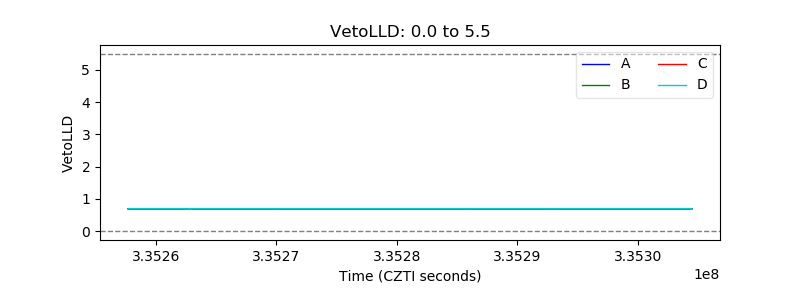 |
| Alpha Counter |  |
| _CPM_Rate |  |
| CZT Counter | 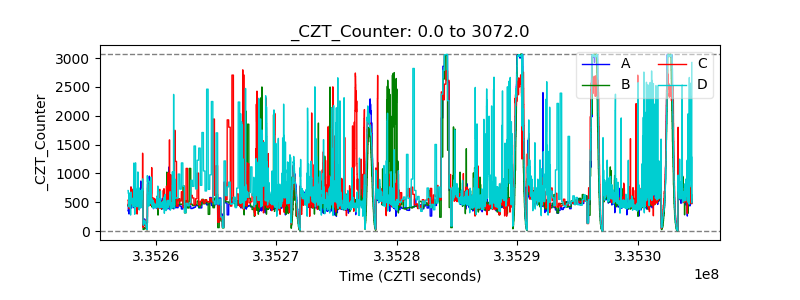 |
| +2.5 Volts monitor |  |
| +5 Volts monitor | 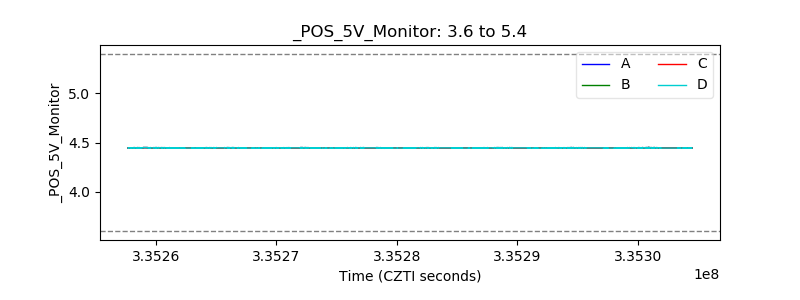 |
| _ROLL_ROT |  |
| _Roll_DEC |  |
| _Roll_RA |  |
| Veto Counter | 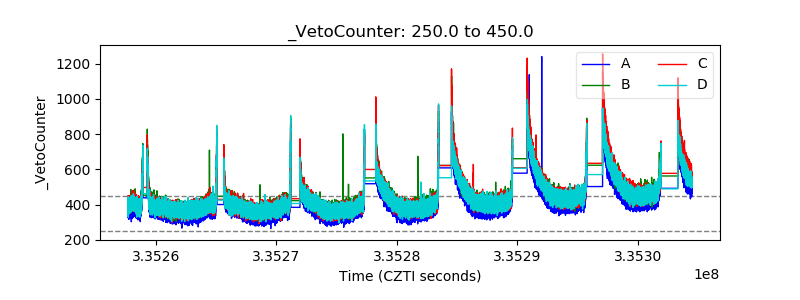 |