| Param | Original file | Final file |
|---|---|---|
| Filename | modeM0/AS1A09_127T01_9000003816cztM0_level2_bc.evt | modeM0/AS1A09_127T01_9000003816cztM0_level2_quad_clean.evt |
| Size (bytes) | 2,372,103,360 | 780,344,640 |
| Size | 2.2 GB | 744.2 MB |
| Events in quadrant A | 12,772,624 | 5,074,297 |
| Events in quadrant B | 16,247,905 | 5,102,518 |
| Events in quadrant C | 23,517,804 | 4,741,444 |
| Events in quadrant D | 15,447,020 | 4,836,128 |
| Mode SS | |||
|---|---|---|---|
| Quadrant | BADHDUFLAG | Total packets | Discarded packets |
| A | 0 | 1146 | 0 |
| B | 0 | 1146 | 0 |
| C | 0 | 1146 | 0 |
| D | 0 | 1146 | 0 |
| Mode M0 | |||
|---|---|---|---|
| Quadrant | BADHDUFLAG | Total packets | Discarded packets |
| A | 0 | 119294 | 0 |
| B | 0 | 134983 | 0 |
| C | 0 | 164565 | 0 |
| D | 0 | 128809 | 0 |
| Mode M9 | |||
|---|---|---|---|
| Quadrant | BADHDUFLAG | Total packets | Discarded packets |
| A | 0 | 100 | 0 |
| B | 0 | 100 | 0 |
| C | 0 | 100 | 0 |
| D | 0 | 100 | 0 |
| Quadrant | Total seconds | Saturated seconds | Saturation percentage |
|---|---|---|---|
| A | 56587 | 597 | 1.055013% |
| B | 56587 | 1936 | 3.421281% |
| C | 56587 | 4675 | 8.261615% |
| D | 56587 | 1015 | 1.793698% |
Noise dominated data is calculated using 1-second bins in cleaned event files. If a bin has >2000 counts, and if more than 50% of those come from <1% of pixels, then it is considered to be noise-dominated and hence unusable.
| Quadrant | # 1 sec bins | Bins with >0 counts | Bins with >2000 counts | High rate bins dominated by noise | Noise dominated (total time) | Noise dominated (detector-on time) | Marked lightcurve |
|---|---|---|---|---|---|---|---|
| A | 66372 | 56591 | 23 | 23 | 0.03% | 0.04% |  |
| B | 66372 | 56587 | 93 | 93 | 0.14% | 0.16% |  |
| C | 66372 | 56585 | 267 | 267 | 0.40% | 0.47% |  |
| D | 66372 | 56587 | 66 | 66 | 0.10% | 0.12% | 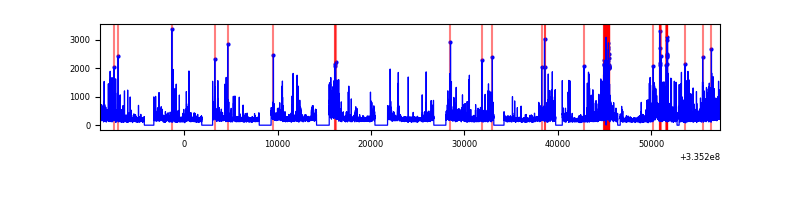 |
Top three noisy pixels from each quadrant. If the there are fewer than three noisy pixels in the level2.evt file, extra rows are filled as -1
| Pixel properties | Quadrant properties | ||||||
|---|---|---|---|---|---|---|---|
| Quadrant | DetID | PixID | Counts | Sigma | Mean | Median | Sigma |
| A | 0 | 13 | 773749 | 1166.77 | 3092 | 3044 | 660.5 |
| A | 13 | 254 | 92950 | 136.11 | 3092 | 3044 | 660.5 |
| A | 6 | 16 | 31495 | 43.07 | 3092 | 3044 | 660.5 |
| B | 0 | 189 | 1821476 | 3115.06 | 3114 | 3046 | 583.8 |
| B | 5 | 172 | 1583678 | 2707.7 | 3114 | 3046 | 583.8 |
| B | 0 | 244 | 268117 | 454.08 | 3114 | 3046 | 583.8 |
| C | 3 | 233 | 8150361 | 11749.76 | 2921 | 2920 | 693.4 |
| C | 2 | 16 | 3310483 | 4769.97 | 2921 | 2920 | 693.4 |
| C | 4 | 254 | 690050 | 990.94 | 2921 | 2920 | 693.4 |
| D | 1 | 52 | 1939615 | 2758.59 | 3035 | 2959 | 702.0 |
| D | 12 | 233 | 1136394 | 1614.48 | 3035 | 2959 | 702.0 |
| D | 2 | 234 | 279351 | 393.69 | 3035 | 2959 | 702.0 |
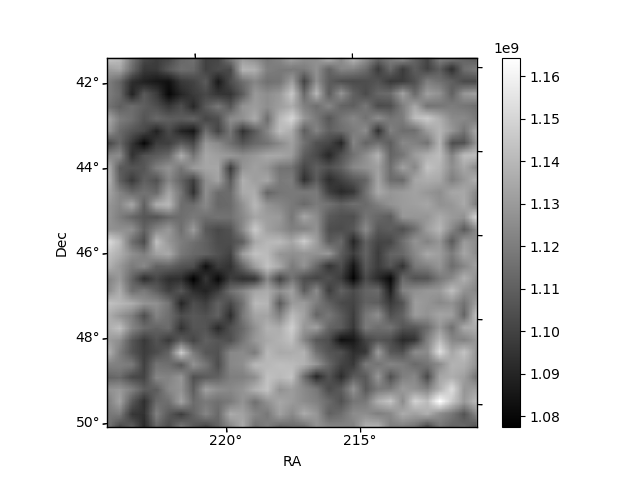
Histogram calculated using DETX and DETY for each event in the final _common_clean file
| Quadrant A | 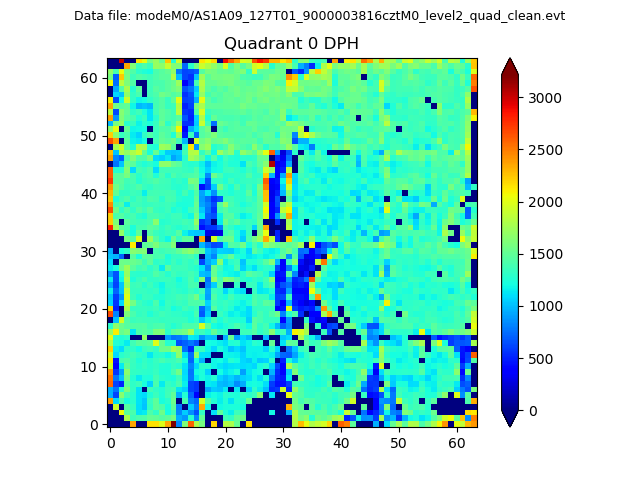 |
 |
Quadrant B |
|---|---|---|---|
| Quadrant D |  |
 |
Quadrant C |
| Plot type | Count rate plots | Images |
|---|---|---|
| Comparison with Poisson distribution Blue bars denote a histogram of data divided into 1 sec bins. Red curve is a Poisson curve with rate = median count rate of data. |
 |
 |
| Quadrant-wise count rates Data is divided into 100 sec bins |
 |
|
| Module-wise count rates for Quadrant A Data is divided into 100 sec bins |
 |
 |
| Module-wise count rates for Quadrant B Data is divided into 100 sec bins |
 |
 |
| Module-wise count rates for Quadrant C Data is divided into 100 sec bins |
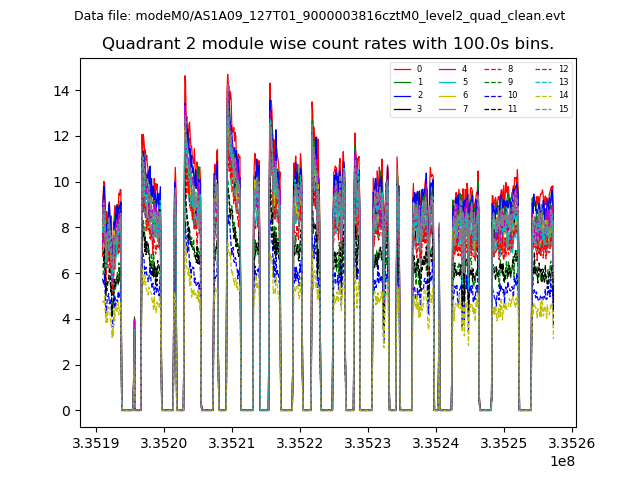 |
 |
| Module-wise count rates for Quadrant D Data is divided into 100 sec bins |
 |
 |
| Parameter | Plot |
|---|---|
| CZT HV Monitor |  |
| D_VDD | 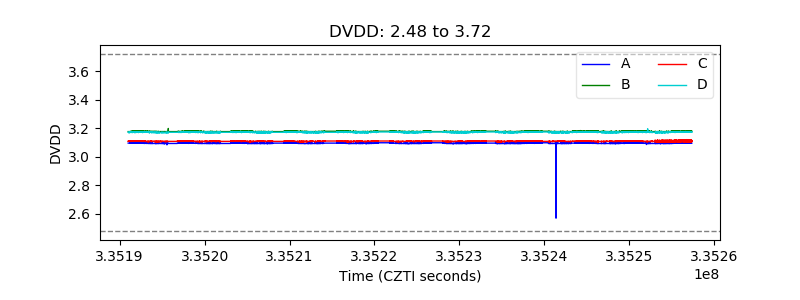 |
| Temperature 1 |  |
| Veto HV Monitor |  |
| Veto LLD |  |
| Alpha Counter |  |
| _CPM_Rate |  |
| CZT Counter |  |
| +2.5 Volts monitor |  |
| +5 Volts monitor |  |
| _ROLL_ROT |  |
| _Roll_DEC |  |
| _Roll_RA |  |
| Veto Counter |  |