| Param | Original file | Final file |
|---|---|---|
| Filename | modeM0/AS1A09_044T02_9000003814cztM0_level2_bc.evt | modeM0/AS1A09_044T02_9000003814cztM0_level2_quad_clean.evt |
| Size (bytes) | 1,269,080,640 | 386,916,480 |
| Size | 1.2 GB | 369.0 MB |
| Events in quadrant A | 7,218,391 | 2,445,991 |
| Events in quadrant B | 7,224,671 | 2,510,430 |
| Events in quadrant C | 8,719,676 | 2,330,146 |
| Events in quadrant D | 13,092,996 | 2,238,473 |
| Mode M0 | |||
|---|---|---|---|
| Quadrant | BADHDUFLAG | Total packets | Discarded packets |
| A | 0 | 68663 | 0 |
| B | 0 | 68497 | 0 |
| C | 0 | 74879 | 0 |
| D | 0 | 89412 | 0 |
| Mode SS | |||
|---|---|---|---|
| Quadrant | BADHDUFLAG | Total packets | Discarded packets |
| A | 0 | 650 | 0 |
| B | 0 | 650 | 0 |
| C | 0 | 650 | 0 |
| D | 0 | 650 | 0 |
| Mode M9 | |||
|---|---|---|---|
| Quadrant | BADHDUFLAG | Total packets | Discarded packets |
| A | 0 | 45 | 0 |
| B | 0 | 45 | 0 |
| C | 0 | 45 | 0 |
| D | 0 | 45 | 0 |
| Quadrant | Total seconds | Saturated seconds | Saturation percentage |
|---|---|---|---|
| A | 31916 | 633 | 1.983331% |
| B | 31916 | 574 | 1.798471% |
| C | 31916 | 1109 | 3.474746% |
| D | 31916 | 1761 | 5.517609% |
Noise dominated data is calculated using 1-second bins in cleaned event files. If a bin has >2000 counts, and if more than 50% of those come from <1% of pixels, then it is considered to be noise-dominated and hence unusable.
| Quadrant | # 1 sec bins | Bins with >0 counts | Bins with >2000 counts | High rate bins dominated by noise | Noise dominated (total time) | Noise dominated (detector-on time) | Marked lightcurve |
|---|---|---|---|---|---|---|---|
| A | 36356 | 31917 | 20 | 20 | 0.06% | 0.06% | 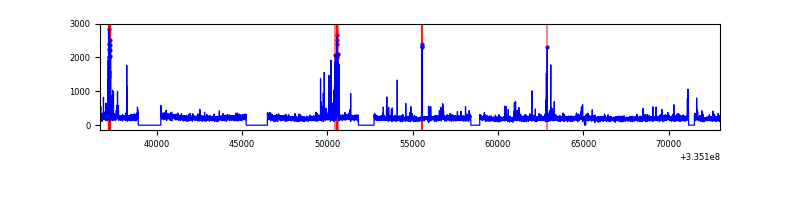 |
| B | 36356 | 31917 | 0 | 0 | 0.00% | 0.00% |  |
| C | 36356 | 31916 | 34 | 34 | 0.09% | 0.11% |  |
| D | 36356 | 31916 | 286 | 286 | 0.79% | 0.90% |  |
Top three noisy pixels from each quadrant. If the there are fewer than three noisy pixels in the level2.evt file, extra rows are filled as -1
| Pixel properties | Quadrant properties | ||||||
|---|---|---|---|---|---|---|---|
| Quadrant | DetID | PixID | Counts | Sigma | Mean | Median | Sigma |
| A | 0 | 13 | 505460 | 1339.17 | 1737 | 1707 | 376.2 |
| A | 13 | 254 | 50369 | 129.36 | 1737 | 1707 | 376.2 |
| A | 0 | 226 | 10888 | 24.41 | 1737 | 1707 | 376.2 |
| B | 0 | 230 | 195537 | 571.91 | 1773 | 1726 | 338.9 |
| B | 0 | 244 | 185033 | 540.91 | 1773 | 1726 | 338.9 |
| B | 0 | 245 | 65169 | 187.21 | 1773 | 1726 | 338.9 |
| C | 3 | 233 | 1976420 | 5044.93 | 1660 | 1650 | 391.4 |
| C | 2 | 16 | 348758 | 886.75 | 1660 | 1650 | 391.4 |
| C | 0 | 207 | 18437 | 42.89 | 1660 | 1650 | 391.4 |
| D | 1 | 52 | 4337883 | 11328.77 | 1651 | 1604 | 382.8 |
| D | 7 | 80 | 1817599 | 4744.39 | 1651 | 1604 | 382.8 |
| D | 12 | 233 | 391512 | 1018.66 | 1651 | 1604 | 382.8 |
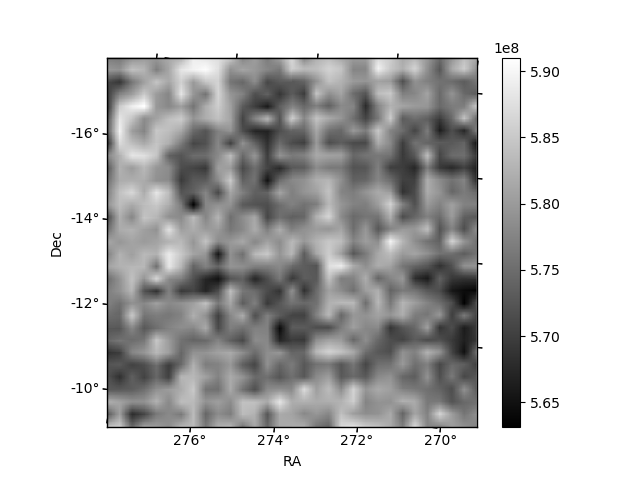
Histogram calculated using DETX and DETY for each event in the final _common_clean file
| Quadrant A |  |
 |
Quadrant B |
|---|---|---|---|
| Quadrant D |  |
 |
Quadrant C |
| Plot type | Count rate plots | Images |
|---|---|---|
| Comparison with Poisson distribution Blue bars denote a histogram of data divided into 1 sec bins. Red curve is a Poisson curve with rate = median count rate of data. |
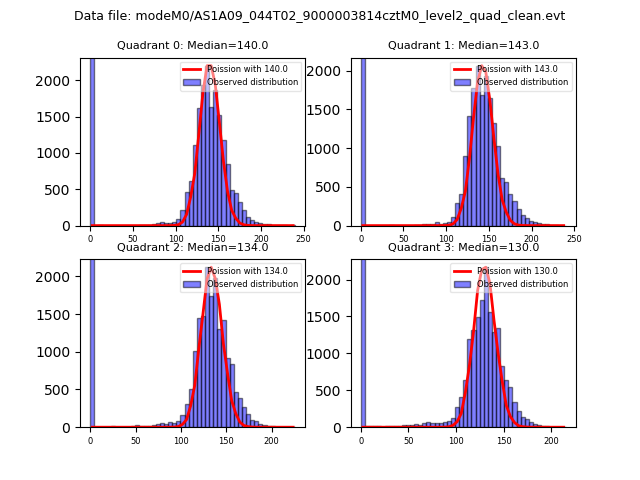 |
 |
| Quadrant-wise count rates Data is divided into 100 sec bins |
 |
|
| Module-wise count rates for Quadrant A Data is divided into 100 sec bins |
 |
 |
| Module-wise count rates for Quadrant B Data is divided into 100 sec bins |
 |
 |
| Module-wise count rates for Quadrant C Data is divided into 100 sec bins |
 |
 |
| Module-wise count rates for Quadrant D Data is divided into 100 sec bins |
 |
 |
| Parameter | Plot |
|---|---|
| CZT HV Monitor |  |
| D_VDD |  |
| Temperature 1 |  |
| Veto HV Monitor |  |
| Veto LLD |  |
| Alpha Counter |  |
| _CPM_Rate |  |
| CZT Counter |  |
| +2.5 Volts monitor | 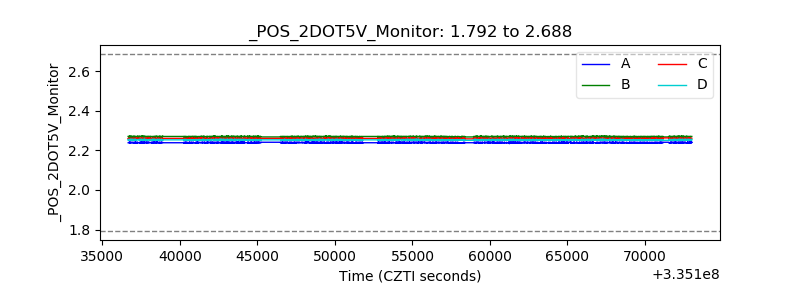 |
| +5 Volts monitor | 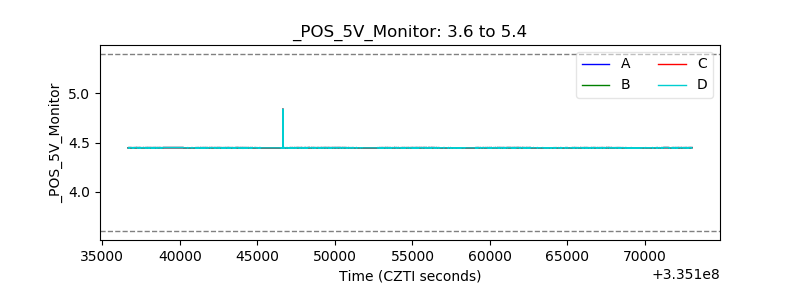 |
| _ROLL_ROT |  |
| _Roll_DEC |  |
| _Roll_RA | 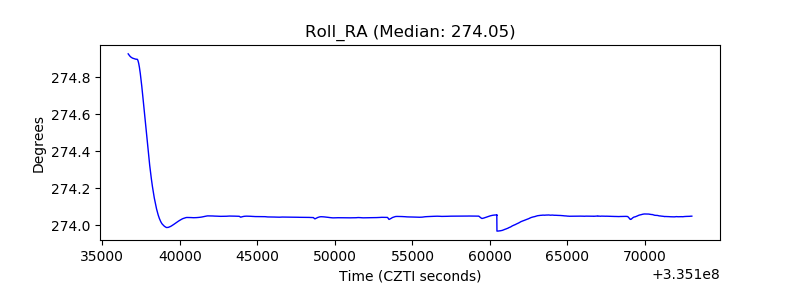 |
| Veto Counter |  |