| Param | Original file | Final file |
|---|---|---|
| Filename | modeM0/AS1A09_008T02_9000003810cztM0_level2_bc.evt | modeM0/AS1A09_008T02_9000003810cztM0_level2_quad_clean.evt |
| Size (bytes) | 340,853,760 | 125,285,760 |
| Size | 325.1 MB | 119.5 MB |
| Events in quadrant A | 1,553,691 | 840,419 |
| Events in quadrant B | 1,491,007 | 875,181 |
| Events in quadrant C | 1,942,732 | 835,248 |
| Events in quadrant D | 4,863,249 | 767,594 |
| Mode SS | |||
|---|---|---|---|
| Quadrant | BADHDUFLAG | Total packets | Discarded packets |
| A | 0 | 138 | 0 |
| B | 0 | 138 | 0 |
| C | 0 | 138 | 0 |
| D | 0 | 138 | 0 |
| Mode M0 | |||
|---|---|---|---|
| Quadrant | BADHDUFLAG | Total packets | Discarded packets |
| A | 0 | 14339 | 0 |
| B | 0 | 14094 | 0 |
| C | 0 | 15919 | 0 |
| D | 0 | 26306 | 0 |
| Mode M9 | |||
|---|---|---|---|
| Quadrant | BADHDUFLAG | Total packets | Discarded packets |
| A | 0 | 13 | 0 |
| B | 0 | 13 | 0 |
| C | 0 | 13 | 0 |
| D | 0 | 13 | 0 |
| Quadrant | Total seconds | Saturated seconds | Saturation percentage |
|---|---|---|---|
| A | 6831 | 47 | 0.688040% |
| B | 6831 | 21 | 0.307422% |
| C | 6831 | 200 | 2.927829% |
| D | 6831 | 1047 | 15.327185% |
Noise dominated data is calculated using 1-second bins in cleaned event files. If a bin has >2000 counts, and if more than 50% of those come from <1% of pixels, then it is considered to be noise-dominated and hence unusable.
| Quadrant | # 1 sec bins | Bins with >0 counts | Bins with >2000 counts | High rate bins dominated by noise | Noise dominated (total time) | Noise dominated (detector-on time) | Marked lightcurve |
|---|---|---|---|---|---|---|---|
| A | 8131 | 6832 | 6 | 6 | 0.07% | 0.09% |  |
| B | 8131 | 6831 | 0 | 0 | 0.00% | 0.00% |  |
| C | 8131 | 6831 | 11 | 11 | 0.14% | 0.16% |  |
| D | 8131 | 6831 | 253 | 253 | 3.11% | 3.70% |  |
Top three noisy pixels from each quadrant. If the there are fewer than three noisy pixels in the level2.evt file, extra rows are filled as -1
| Pixel properties | Quadrant properties | ||||||
|---|---|---|---|---|---|---|---|
| Quadrant | DetID | PixID | Counts | Sigma | Mean | Median | Sigma |
| A | 0 | 13 | 117382 | 1435.8 | 371 | 364 | 81.5 |
| A | 13 | 254 | 9553 | 112.75 | 371 | 364 | 81.5 |
| A | 6 | 16 | 5734 | 65.89 | 371 | 364 | 81.5 |
| B | 0 | 230 | 27160 | 369.58 | 380 | 373 | 72.5 |
| B | 7 | 219 | 4828 | 61.47 | 380 | 373 | 72.5 |
| B | 15 | 222 | 3534 | 43.61 | 380 | 373 | 72.5 |
| C | 3 | 233 | 402258 | 4576.17 | 365 | 365 | 87.8 |
| C | 4 | 254 | 92619 | 1050.45 | 365 | 365 | 87.8 |
| C | 2 | 16 | 44676 | 504.55 | 365 | 365 | 87.8 |
| D | 7 | 80 | 2590382 | 31422.79 | 348 | 339 | 82.4 |
| D | 1 | 52 | 795239 | 9643.85 | 348 | 339 | 82.4 |
| D | 11 | 176 | 103904 | 1256.47 | 348 | 339 | 82.4 |
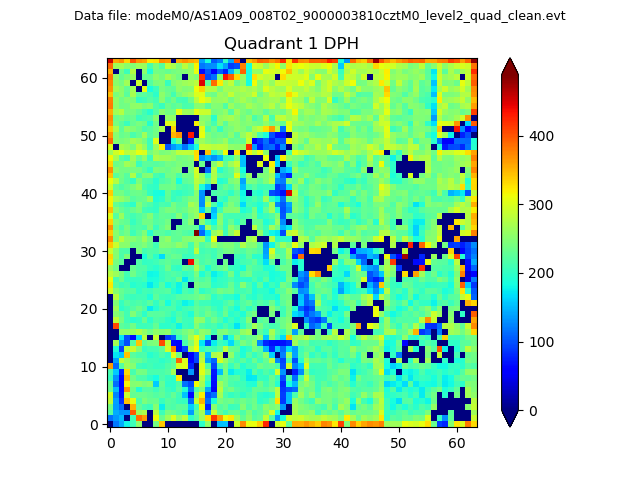
Histogram calculated using DETX and DETY for each event in the final _common_clean file
| Quadrant A |  |
 |
Quadrant B |
|---|---|---|---|
| Quadrant D |  |
 |
Quadrant C |
| Plot type | Count rate plots | Images |
|---|---|---|
| Comparison with Poisson distribution Blue bars denote a histogram of data divided into 1 sec bins. Red curve is a Poisson curve with rate = median count rate of data. |
 |
 |
| Quadrant-wise count rates Data is divided into 100 sec bins |
 |
|
| Module-wise count rates for Quadrant A Data is divided into 100 sec bins |
 |
 |
| Module-wise count rates for Quadrant B Data is divided into 100 sec bins |
 |
 |
| Module-wise count rates for Quadrant C Data is divided into 100 sec bins |
 |
 |
| Module-wise count rates for Quadrant D Data is divided into 100 sec bins |
 |
 |
| Parameter | Plot |
|---|---|
| CZT HV Monitor |  |
| D_VDD | 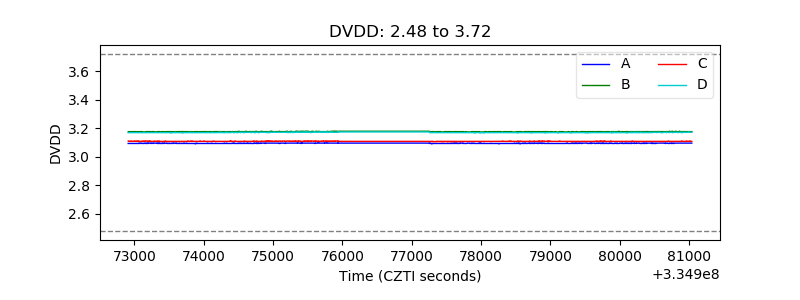 |
| Temperature 1 |  |
| Veto HV Monitor |  |
| Veto LLD |  |
| Alpha Counter |  |
| _CPM_Rate |  |
| CZT Counter |  |
| +2.5 Volts monitor |  |
| +5 Volts monitor |  |
| _ROLL_ROT |  |
| _Roll_DEC |  |
| _Roll_RA |  |
| Veto Counter |  |