| Param | Original file | Final file |
|---|---|---|
| Filename | modeM0/AS1A09_143T05_9000003804cztM0_level2_bc.evt | modeM0/AS1A09_143T05_9000003804cztM0_level2_quad_clean.evt |
| Size (bytes) | 845,184,960 | 257,016,960 |
| Size | 806.0 MB | 245.1 MB |
| Events in quadrant A | 3,761,287 | 1,699,849 |
| Events in quadrant B | 4,382,017 | 1,703,850 |
| Events in quadrant C | 8,833,439 | 1,537,905 |
| Events in quadrant D | 7,378,477 | 1,591,982 |
| Mode M0 | |||
|---|---|---|---|
| Quadrant | BADHDUFLAG | Total packets | Discarded packets |
| A | 0 | 37306 | 0 |
| B | 0 | 39641 | 0 |
| C | 0 | 58622 | 0 |
| D | 0 | 49871 | 0 |
| Mode M9 | |||
|---|---|---|---|
| Quadrant | BADHDUFLAG | Total packets | Discarded packets |
| A | 0 | 22 | 0 |
| B | 0 | 22 | 0 |
| C | 0 | 22 | 0 |
| D | 0 | 22 | 0 |
| Mode SS | |||
|---|---|---|---|
| Quadrant | BADHDUFLAG | Total packets | Discarded packets |
| A | 0 | 370 | 0 |
| B | 0 | 370 | 0 |
| C | 0 | 370 | 0 |
| D | 0 | 370 | 0 |
| Quadrant | Total seconds | Saturated seconds | Saturation percentage |
|---|---|---|---|
| A | 18141 | 139 | 0.766220% |
| B | 18141 | 281 | 1.548977% |
| C | 18141 | 1928 | 10.627860% |
| D | 18141 | 984 | 5.424177% |
Noise dominated data is calculated using 1-second bins in cleaned event files. If a bin has >2000 counts, and if more than 50% of those come from <1% of pixels, then it is considered to be noise-dominated and hence unusable.
| Quadrant | # 1 sec bins | Bins with >0 counts | Bins with >2000 counts | High rate bins dominated by noise | Noise dominated (total time) | Noise dominated (detector-on time) | Marked lightcurve |
|---|---|---|---|---|---|---|---|
| A | 20401 | 18141 | 1 | 1 | 0.00% | 0.01% | 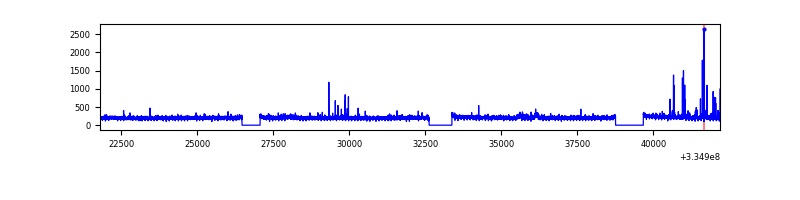 |
| B | 20401 | 18141 | 23 | 23 | 0.11% | 0.13% |  |
| C | 20401 | 18141 | 75 | 75 | 0.37% | 0.41% | 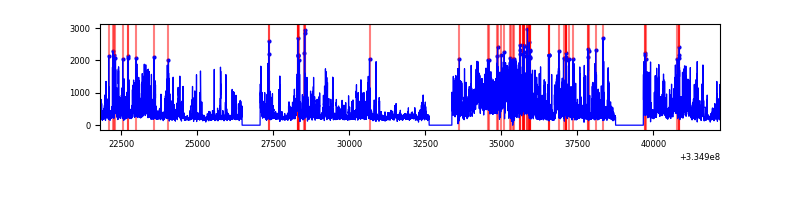 |
| D | 20401 | 18140 | 164 | 164 | 0.80% | 0.90% |  |
Top three noisy pixels from each quadrant. If the there are fewer than three noisy pixels in the level2.evt file, extra rows are filled as -1
| Pixel properties | Quadrant properties | ||||||
|---|---|---|---|---|---|---|---|
| Quadrant | DetID | PixID | Counts | Sigma | Mean | Median | Sigma |
| A | 0 | 13 | 80423 | 386.51 | 933 | 914 | 205.7 |
| A | 6 | 16 | 73729 | 353.97 | 933 | 914 | 205.7 |
| A | 13 | 254 | 30461 | 143.63 | 933 | 914 | 205.7 |
| B | 5 | 172 | 480901 | 2636.28 | 936 | 911 | 182.1 |
| B | 0 | 230 | 194986 | 1065.93 | 936 | 911 | 182.1 |
| B | 0 | 219 | 53451 | 288.57 | 936 | 911 | 182.1 |
| C | 3 | 233 | 4522961 | 21627.78 | 864 | 858 | 209.1 |
| C | 0 | 239 | 898948 | 4295.28 | 864 | 858 | 209.1 |
| C | 14 | 225 | 32640 | 152.0 | 864 | 858 | 209.1 |
| D | 1 | 52 | 3162142 | 14949.05 | 898 | 870 | 211.5 |
| D | 12 | 233 | 445300 | 2101.62 | 898 | 870 | 211.5 |
| D | 11 | 176 | 155695 | 732.14 | 898 | 870 | 211.5 |
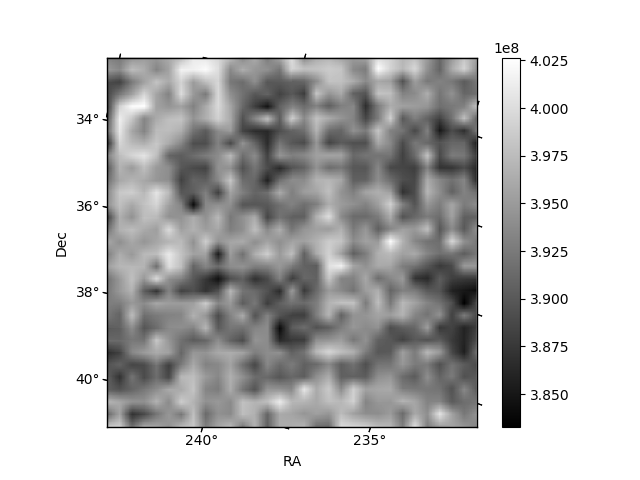
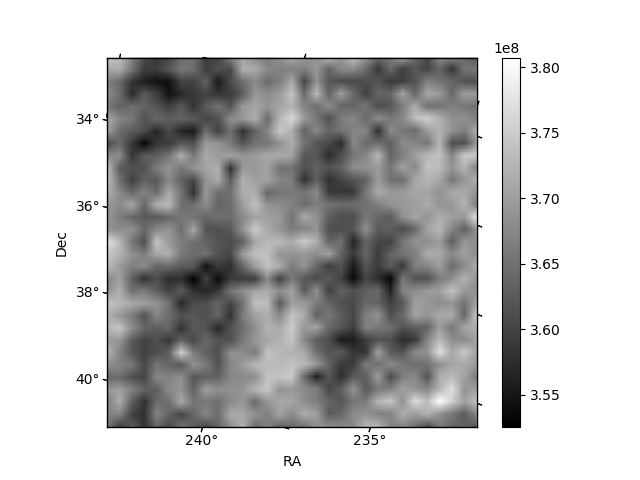
Histogram calculated using DETX and DETY for each event in the final _common_clean file
| Quadrant A |  |
 |
Quadrant B |
|---|---|---|---|
| Quadrant D |  |
 |
Quadrant C |
| Plot type | Count rate plots | Images |
|---|---|---|
| Comparison with Poisson distribution Blue bars denote a histogram of data divided into 1 sec bins. Red curve is a Poisson curve with rate = median count rate of data. |
 |
 |
| Quadrant-wise count rates Data is divided into 100 sec bins |
 |
|
| Module-wise count rates for Quadrant A Data is divided into 100 sec bins |
 |
 |
| Module-wise count rates for Quadrant B Data is divided into 100 sec bins |
 |
 |
| Module-wise count rates for Quadrant C Data is divided into 100 sec bins |
 |
 |
| Module-wise count rates for Quadrant D Data is divided into 100 sec bins |
 |
 |
| Parameter | Plot |
|---|---|
| CZT HV Monitor |  |
| D_VDD |  |
| Temperature 1 |  |
| Veto HV Monitor |  |
| Veto LLD |  |
| Alpha Counter |  |
| _CPM_Rate |  |
| CZT Counter |  |
| +2.5 Volts monitor |  |
| +5 Volts monitor |  |
| _ROLL_ROT | 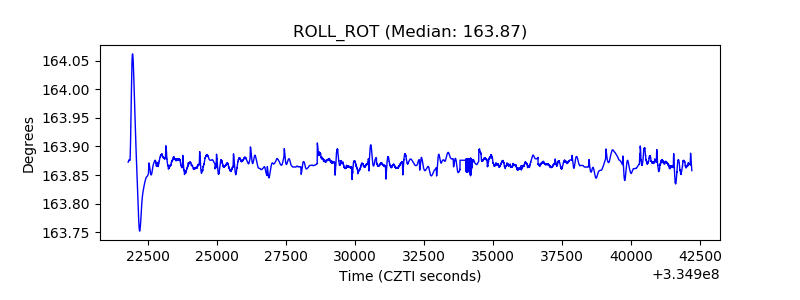 |
| _Roll_DEC |  |
| _Roll_RA |  |
| Veto Counter |  |